
Talking Points:
- AUD/USD 1-day implied volatility is at 9.53%, which is the most in just about three weeks
- Trade talks amidst holiday illiquid may cause sharp price movements if sentiment changes
- As AUD/USD fell, it formed a bullish reversal pattern and downside momentum is ebbing
Trade all the major global economic data live and interactive at the DailyFX Webinars. We’d love to have you along.
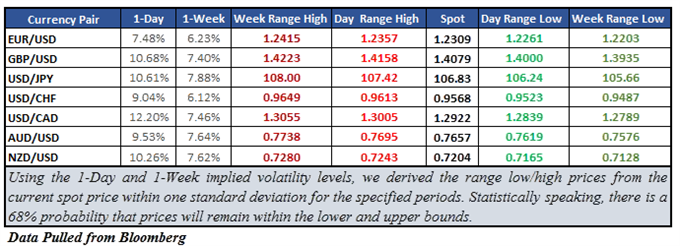
AUD/USD 1-day implied volatility might not be the most of the majors at 9.53%, but it is near a three-week high. In fact, this measurement has been steadily increasing since the beginning of this week. Looking ahead, the respective 1-week reading is amongst the largest of the pairs at 7.64%. Even though we are heading into a holiday weekend, traders should keep an eye out if political news suddenly impacts sentiment.
Implied Volatility and Market Range for the FX Majors
This has been the case so far this week. On Monday trade war fears ebbed which sent stocks and the sentiment-linked Australian Dollar higher. Then, the mood quickly reversed on Tuesday as the Trump administration considered a crackdown on Chinese investments in technologies. Just yesterday, news that North Korea wants to hold a summit talk with Japan sent the Nikkei 225 and Aussie Dollar on their way up.
With the Good Friday holiday approaching, it is no surprise to see suppressed forward looking measurements of implied volatility. Traders expect calmer conditions, but the risk of illiquidity may amplify price action suddenly. Especially if more trade developments cross the wires and impact sentiment. Yesterday, we wrote about how Canadian Dollar implied volatility
is also amplified amidst ongoing NAFTA/tariff negotiations
.
Looking ahead, AUD/USD faces the RBA rate decision next week. Economists are calling for rates to stay unchanged at 1.50%. The central bank has hinted in the past that it is in no rush to raise rates. The markets seem to be slowly listening, overnight index swaps are now pricing in a 37.7% chance that the RBA will hike once by the end of the year. This has been falling form about 80% confidence since January.
AUD/USD Technical Analysis: The Formation of a Bullish Reversal Pattern
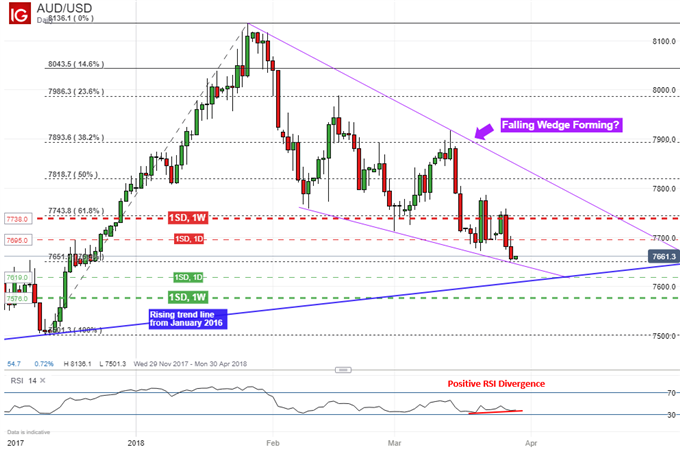
On a daily chart, AUD/USD has been falling since the beginning of February. During this time, it appears to have formed a falling wedge which is a bullish reversal pattern. However, for this pattern to complete, the pair will have to climb and break above the upper descending line. At this point, this could be some time away. However, positive RSI divergence hints at ebbing momentum to the downside.
If AUD/USD turns higher, the “day range high” at 0.7695 could be immediate resistance over the next 24 hours. A push above that exposes the “week range high” at 0.7738 which is closely aligned with the 61.8% Fibonacci retracement.
On the other hand, prices may keep falling. Though the pair seems to be stuck right on top of the 76.4% level. In addition, the lower line of the falling wedge may tame its descent. From here, the “day range low” at 0.7619 can be immediate support. A push below that exposes the rising trend line from January 2016. Should AUD/USD fall below that, the “week range low” at 0.7576 could be the next target.
AUD/USD Trading Resources:
- Just getting started? See our beginners’ guide for FX traders
- Having trouble with your strategy? Here’s the #1 mistake that traders make
— Written by Daniel Dubrovsky, Junior Currency Analyst for DailyFX.com
To contact Daniel, use the comments section below or @ddubrovskyFX on Twitter
To receive Daniel‘s analysis directly via email, please SIGN UP HERE