
GBP News and Talking points
- Sterling falls through 1.4200 after soft production figures, construction output drop
- UK trade deficit widens due to decline in non-EU goods exports
- Eyes on BoE speech with Governor Carney and Broadbent set to speak tomorrow
The new DailyFX Q2 Trading Forecasts are now available to help you make more informed trading decisions.
The Pound slipped and FTSE 100 edged up Wednesday morning following a run of February data. In the three months to February, the total UK trade deficit (goods and services) had widened by £0.4bln to £6.4bln, which was largely been due to the £2.1bln decline in non-EU goods exports. This is somewhat smaller than the prior month’s £3.2bln widening. Key to the decline in that segment of trade was due to the a wider fuel trade deficit after the closure of the Forties pipeline system, which accounts for around 40% of the UK’s crude oil exports.
The trade in goods deficit with the EU narrowed by £2.9bln, which is particularly noteworthy given that the next few months on the Brexit front will be dominated by trade discussions between the UK and the EU. UK officials are hoping to move towards an agreement on the framework for a future relationship in the second half of the year.
UK Q1 GDP Likely to Get Off to a Soft Start to 2018.
Elsewhere, manufacturing, construction and industrial production figures had all missed economists’ estimates. Manufacturing production had declined by 0.2% compared to expectations of a modest 0.2% rise, which marked the first time that output had fallen since March 2017. while Industrial production dipped by 0.1% due to the 8.6% decline in mining and quarrying caused by the shutdown of the Forties crude pipeline in December. In turn, this has pushed GBP/USD back below the 1.4200 handle. Altogether, this data suggests that the Q1 UK GDP is likely to get off to a softer start, with recent PMI survey’s suggesting UK growth of around 0.3%.
PRICE CHART 1: GBP/USD 1-MINUTES TIME FRAME (INTRADAY APRIL 11, 2018)

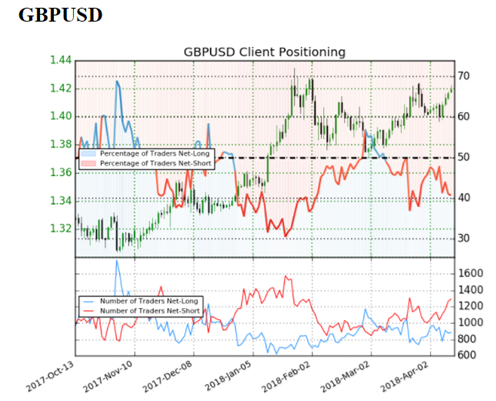
GBPUSD: Data shows 40.7% of traders are net-long with the ratio of traders short to long at 1.46 to 1. In fact, traders have remained net-short since Mar 21 when GBPUSD traded near 1.40244; price has moved 1.2% higher since then. The percentage of traders net-long is now its lowest since Mar 28 when GBPUSD traded near 1.40768. The number of traders net-long is 2.0% lower than yesterday and 10.0% lower from last week, while the number of traders net-short is 10.0% higher than yesterday and 18.2% higher from last week.
We typically take a contrarian view to crowd sentiment, and the fact traders are net-short suggests GBPUSD prices may continue to rise. Traders are further net-short than yesterday and last week, and the combination of current sentiment and recent changes gives us a stronger GBPUSD-bullish contrarian trading bias.
Learn more about the IG Client Sentiment Index on the DailyFX Sentiment page
— Written by Justin McQueen, Market Analyst
To contact Justin, email him at Justin.mcqueen@ig.com
Follow Justin on Twitter @JMcQueenFX