
GBP TALKING POINTS:
– UK figures for industrial production, manufacturing output, trade and construction are all due this session.
– As always, better-than-expected numbers would give GBP a lift; poor data would weaken it.
– While trade figures are always important, the manufacturing numbers are probably the ones most likely to have an impact on the Pound.
TRADING THE NEWS: UK TRADE, PRODUCTION & CONSTRUCTION

Trading GBPUSD and EURGBP around this session’s data will not be easy with so many figures scheduled for release. However, the British Pound is currently edging higher and the bias could well be for more, if limited, gains.
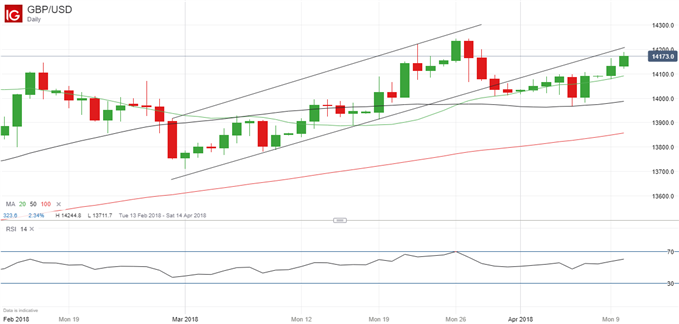
As noted here yesterday, GBP’s rally seems currently to be losing momentum but it has, nonetheless, advanced against the USD for eight of the past nine sessions.
GBPUSD PRICE CHART, DAILY TIMEFRAME (FEBRUARY 13 – APRIL 10, 2018)
For longer-term predictions, take a look at our Q2 forecasts for the major currency pairs, gold, oil and equities.
This session’s data could well reinforce the impression that the UK economy is relatively healthy at present. Two of the nine members of the Bank of England’s Monetary Policy Committee have already voted for higher UK interest rates, and the agreement between the UK and the EU on a Brexit transition period has improved GBP sentiment. The upside bias in GBPUSD should therefore remain intact.
Industrial production is expected to have risen by 2.9% year/year in February, up from 1.6% in January, as cold weather boosted the utilities sector. Moreover, the manufacturing output number – which excludes mining, energy, water supplies and so on – may well have climbed too, despite a negative impact on exports from a firmer Pound.
If so, that would be seen as bringing the next UK interest rate rise still closer, particularly if the trade deficit shows the expected fall and the construction sector improves as forecast – hence the upside bias in GBPUSD.
GBPUSD levels to watch out for
Returning to the GBPUSD chart, the key levels to watch out for on the upside are 1.4208 where the trendline resistance is currently, and then the March 26/27 highs at 1.4244. To the downside there is support at 1.4090 from the 20-day moving average, at 1.3985 from the 50-day moving average and at 1.3965 from the April 5 low.
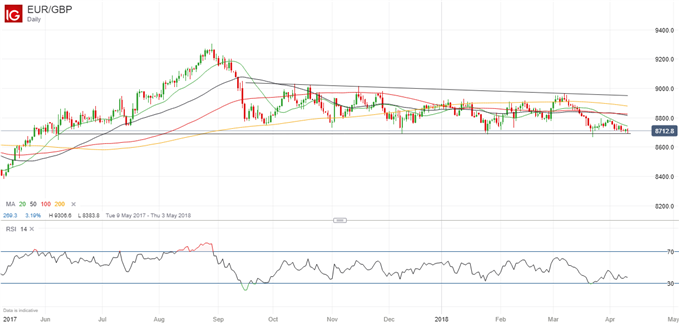
Turning to EURGBP, the current price is very close to the bottom of the trading range in place since last September. This suggests that if GBP can strengthen further, EURGBP could fall sharply – perhaps in due course as far as last May’s 83.84 low. Nonetheless, trendline resistance is now strong and will be hard to break through.
EURGBP PRICE CHART, DAILY TIMEFRAME (MAY 9, 2017 – APRIL 10, 2018)
Check out the IG Client Sentiment data to help you trade profitably.
If you’d like to learn how to trade like an expert, you can read our guide to the Traits of Successful Traders. Some of the key lessons are:
– Successful traders cut losses, and let profits run,
– Successful traders use leverage effectively, and
– Successful traders trade at the right time of day.
For more help to trade profitably listen to our regular Trading Webinars.
— Written by Martin Essex, Analyst and Editor
Feel free to contact me via the comments section below, via email at martin.essex@ig.com or on Twitter @MartinSEssex