
NZ Trade Balance and NZD/USD Talking Points:
- NZD/USD falls, then pulls back up on New Zealand’s March trade balance report
- There was a deficit surprise, but either way it may not impact the RBNZ policy path
- The New Zealand Dollar could decline against USD on Friday’s US Q1 GDP data
Just getting started trading the New Zealand Dollar? See our beginners’ guide for FX traders to learn how you can apply this in your strategy!
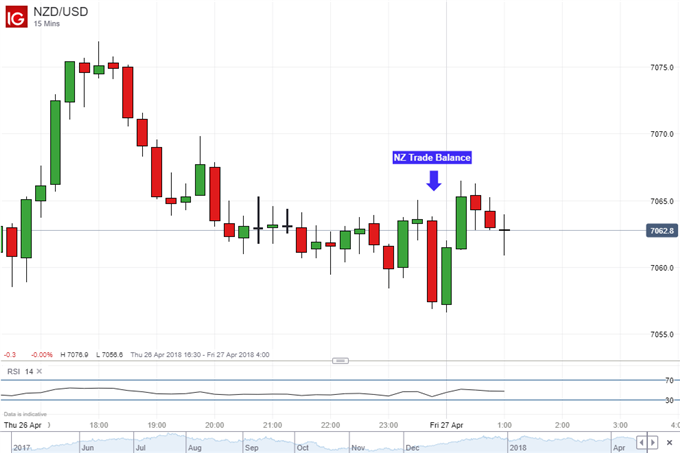
The New Zealand Dollar declined against its major counterparts after a local trade balance report crossed the wires, and NZD/USD could be at risk of more declines ahead. Instead of an estimated NZD275 million surplus, New Zealand’s March net exports (another term for trade balance) turned out to be a deficit of NZD86 million. Meanwhile, the on-year deficit further deepened to –NZD3,421m from NZD-3,019m which was the largest one since November 2017.
Exports increased by NZD4.85 billion which was lower than the projected NZD4.91b gain. Those goods heading to China, its largest trading partner, fell by 4.3% y/y. Imports on the other hand surged by NZD4.94b which was higher than the NZD4.80b estimate. In addition, items purchased and brought home from abroad rose by 14.1% y/y which was the highest pace since January.
When net exports are negative, they can subtract from a country’s GDP results. This is because the trade balance is one of the four main components of calculating growth. While this could bode-ill for hawkish RBNZ monetary policy expectations, the central bank has either way shown us that they are in no rush to raise rates. Perhaps this could have been why NDZ/USD pulled back after the data.
Still, as we finish the last trading day of the week, the NZD/USD could be at risk of falling. This could happen when the first quarter US GDP report crosses the wires. Very recently, data out of the world’s largest economy has been tending to outperform relative to economists’ expectations. If a similar situation occurs with the GDP figures, then the New Zealand Dollar could depreciate against its US cousin.
NZD/USD Technical Analysis: Held Up By January’s Low, December Next?
On a daily chart, after putting in an intense decline, NZD/USD finds itself being supported by this year’s January 1st low at 0.7055. Leading into this move, negative RSI divergence built up as the pair tested the July 2017 falling line. This warned that prices were getting ready to perhaps turn lower, and they sure did.
From here, if NZD/USD can push below 0.7055 and head for 2017 lows, then the 61.8% Fibonacci retracement at 0.7031 could stand in the way as support. A push below that exposes the 76.4% level at 0.6935. On the other hand, if prices turn higher, than the 50% midpoint at 0.7109 could end up as near-term resistance. A push higher exposes the 38.2% level at 0.7186.

NZD/USD Trading Resources:
- Join a free Q&A webinar and have your trading questions answered
- Having trouble with your strategy? Here’s the #1 mistake that traders make
- See how the New Zealand Dollar is viewed by the trading community at the DailyFX Sentiment Page
— Written by Daniel Dubrovsky, Junior Currency Analyst for DailyFX.com
To contact Daniel, use the comments section below or @ddubrovskyFX on Twitter
To receive Daniel‘s analysis directly via email, please SIGN UP HERE