

Talking Points:
- S&P 500, Dow & Nasdaq Charts Working Towards Completing Tops.
- S&P 500 Grasps for Support as Treasury Yields, US Dollar Continue to Gain.
- Trading USD Pairs? Our IG Client Sentiment follows traders’ positioning on key Dollar-pairs like EUR/USD, GBP/USD and USD/JPY.
Forecast for the S&P 500: Neutral
The Quarterly Forecast for the S&P 500 have just been released for Q2, Click here for full access to the DailyFX Q2 Forecasts.
Next week’s economic calendar brings an intense focus on to US-related items, and the breakout that took place in the US Dollar this week will very much be in question. On top of a rather stacked macro-economic calendar, we’re in the thick of earnings season and we’ll see a number of big US names reporting next week: McDonalds reports on Monday, Apple reports on Tuesday and Tesla reports on Wednesday in what will be a widely-watched earnings call for signs of trouble at the auto/battery maker.
Earnings were fairly strong this week, led by a strong beat from Amazon. But, the net of that strength in earnings has been a simple doji in the S&P 500, further evidence that other factors are at work here. This narrows the index further into the wedge pattern that’s been building since early-February; highlighting the fact that a ‘big’ move may be on the horizon, in one direction or the other, as prices congest after a historically strong nine-year bull market.
S&P 500 Daily Chart: Narrowing/Congesting Price Action After Volatility Comes Back in Q1

Chart prepared by James Stanley
This congestion leaves the S&P in a rather neutral state on a longer-term basis. While that prior bullish trend has yet to reverse, an increase in volatility similar to what we’ve seen since early-February is often indicative of a shift in market behavior or mood; and as confirmation, the prior ‘buy the dip’ strategy has lost a bit of luster. It hasn’t yet fully morphed into ‘sell the rip’ mode, but that may be nearing if we put in another test of the 2530 double bottom from the February lows.
Until then, or until we get a topside break back above 2750, traders would likely want to stick to shorter-term setups, looking to work within the cracks of price action until a more decisive directional move avails itself.
On the four-hour chart below, we’re looking at two Fibonacci retracements: In dark blue, we have a retracement built from the February sell-off and in orange, we have a retracement taken from the February/March bounce. A hold of confluent support around 2662 after next week’s open brings the potential for a retest of the 50% retracement at 2703.
S&P 500 Four-Hour Chart: Operable Levels Within the Bigger Picture Congestion

Chart prepared by James Stanley
DAX: Reversal Potential
Forecast for Next Week: Bearish
European stocks received a nice boost this week from a quick hit of weakness to the single currency. This was brought upon by a dovish outlay at the ECB, and in short order the Euro was dropping and European stocks popped higher.
This led to a gap-higher in the DAX, but buyers were unable to continue the move. This left DAX price action on Friday as a doji, and given that we have an indecision formation so near a key area of prior resistance, the door is opened for short-side should this area of resistance hold through next week’s open.
Next week’s data outlay out of Europe is of interest to this theme, as we get German inflation figures on Monday morning, followed by Euro-Zone GDP on Wednesday and Euro-Zone CPI on Thursday.
DAX Daily Chart: Doji Near Resistance After ECB-Fueled Strength in European Stocks

Chart prepared by James Stanley
FTSE: Q1 Dip Leads into Q2 Rip
Forecast for next Week: Neutral
The FTSE 100 is up by 9.2% since the March 26th low, and that bullish move saw considerable extension this week as the British Pound continued to get slammed. The bearish theme in GBP/USD is continuing after last week’s disappointing inflation numbers; and this morning saw another sell-off in the currencies while stocks extended their bullish ascent after GDP numbers printed with disappointment as well.
This makes for a less certain backdrop around the Bank of England as we approach the May ‘Super Thursday’ event; and that takes place in the week after next. While odds were previously over 90% for a hike at that rate decision, probabilities have now moved below 30% after the recent deterioration seen in UK data this week. This has been helpful to British stocks, as evidenced by the return of strength as we came into Q2.
FTSE Weekly Chart: Q1 Slump Brings 38.2% Retracement; Followed by Q2 Jump
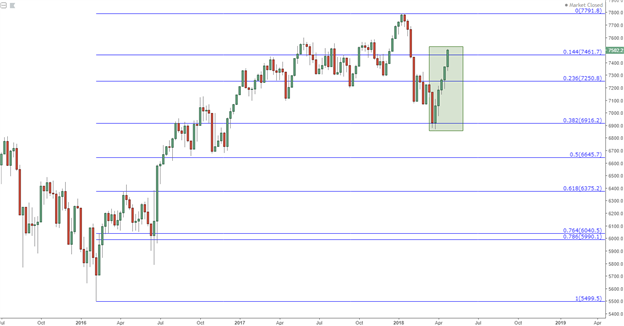
Chart prepared by James Stanley
FTSE: Resistance Potential 7550-7600
Of interest around the FTSE at the moment is a zone of resistance just above current price action. This area had held the highs in the index for most of the second half of 2017, and if we do get a revisit here, interest populates around possible reversal formations.
FTSE Daily Chart
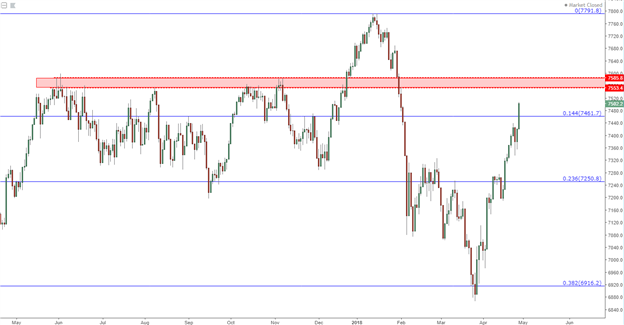
Chart prepared by James Stanley
To read more:
Are you looking for longer-term analysis on the U.S. Dollar? Our DailyFX Forecasts for Q1 have a section for each major currency, and we also offer a plethora of resources on USD-pairs such as EUR/USD, GBP/USD, USD/JPY, AUD/USD. Traders can also stay up with near-term positioning via our IG Client Sentiment Indicator.
— Written by James Stanley, Strategist for DailyFX.com
To receive James Stanley’s analysis directly via email, please SIGN UP HERE
Contact and follow James on Twitter: @JStanleyFX