GBPUSD Analysis and News
- PMI surveys point to 0.2% growth in Q2, marking the second weakest since the Brexit vote
- Weak economy and Brexit uncertainty reign in expectations of a BoE interest rate hike
Poor UK PMI Data Takes May Rate Rise Firmly Off the Table
Today’s UK Service PMI rounded up what has been another disappointing week on the macro front for the UK. The release saw a slight pick up to 52.8 in April from the 20-month low of 51.7, however, underwhelmed expectations of 53.5, suggesting that the underlying economy remains fragile as opposed to weather induced weakness, in response GBPUSD fell through 1.3600 to revisit lows of 1.3555. IHS Markit reported that the PMI surveys collectively, pointed to Q2 GDP of 0.2% (second weakest since the Brexit vote). In turn, the most recent data points, coupled with cautious comments from BoE members indicate that a rate hike for May is completely off the table.
Bank of England Future Rate Path
Alongside the recent weakening UK data, Brexit concerns have also fueled the selling in the Pound with the EU cranking up pressure on the UK to find a workable solution to the Irish border, while trade discussion are set to heat later this year, subsequently reducing the case to raise rates later this year. As such, the mixture of Brexit uncertainty and a weak economy, provides the bearish theme for GBP in the near term.
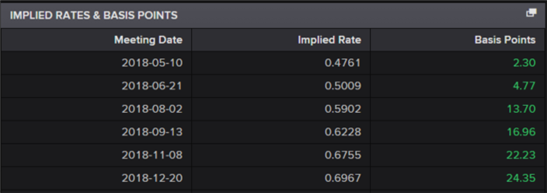
The big question is whether the Bank of England will deliver a rate hike in 2018 and according to market pricing, a 25bps hike is near enough fully priced in for the December meeting. The August meeting will garner attention as this will be when the next quarterly inflation report will be released (after May meeting) where markets are pricing in around a 55% chance (13.7bps of tightening) the BoE will deliver a hike.

Source: Thomson Reuters
GBPUSD PRICE CHART: DAILY TIME FRAME (FEB 2017-MAY 3, 2018)

GBPUSD Technical Analysis Levels
Levels to the downside, the 50% fibonaci retracement of the June 2017 low to the 2018 high is situated at 1.34900, before the January 11th low at 1.3458. Reminder, the Relative Strength Index is below the oversold 30 level, which could suggest a possible reversal. On the topside, resistance comes in at 1.3659 (2017 high), while the 38.2% fibonaci retracement sits at 1.3699.
See how retail traders are positioning in GBPUSD as well as other major FX pairs on an intraday basis using the DailyFX speculative positioning data on the sentiment page.
For a more in-depth analysis on Sterling, check out the Q2 Forecast for GBP/USD
— Written by Justin McQueen, Market Analyst
To contact Justin, email him at Justin.mcqueen@ig.com
Follow Justin on Twitter @JMcQueenFX