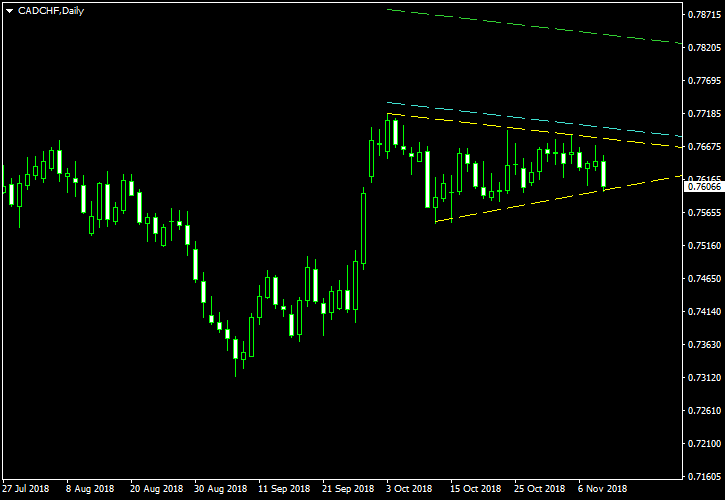
The Canadian dollar has formed a symmetrical triangle pattern versus the Swiss franc, which is especially visible on daily timeframe. The pattern follows an upswing and suggests a continuation of the bullish trend in case of a topside breakout.
The borders of the triangle are marked with the yellow lines on the image below. My potential entry level is marked with the cyan line, which is placed at 10% of the triangle’s base width above the upper border. My take-profit will be placed where the green line is, which is 100% of the triangle’s base width above the upper border. I will set my stop-loss to the low of the breakout candle or to the low of the preceding candle if the former is mostly outside the triangle. I will ignore bearish breakouts from this symmetrical triangle. You can click on the image below to see a full-size chart.

I have built this chart using the ChannelPattern script. You can download my MetaTrader 4 chart template for this CAD/CHF pattern. You can trade it using my free Chart Pattern Helper EA.
If you have any questions or comments regarding this symmetrical triangle on the CAD/CHF chart, please feel free to submit them via the form below.