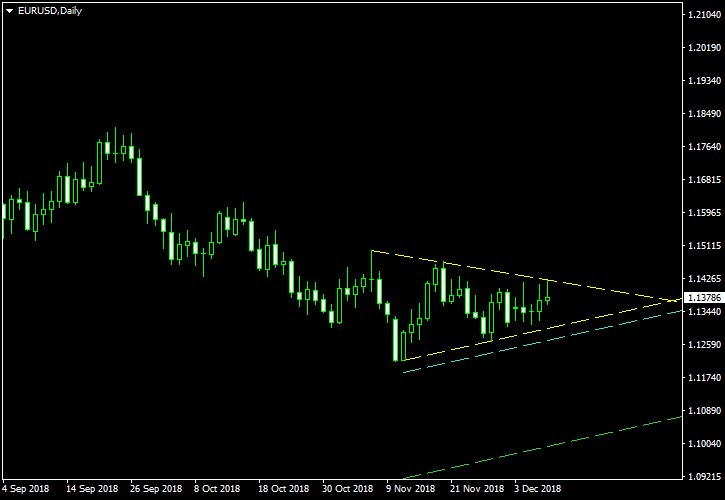
The previous EUR/USD symmetrical triangle formation was a long-term one — it lasted through the entire summer of 2018. The current one is a short-term one, having started just a month ago. Although the previous pattern failed as a trade, the currency pair indeed continued its downward trend. The current triangle offers an interesting opportunity to trade a bearish breakout on EUR/USD daily chart.
The triangle’s borders are the yellow lines. The cyan line is the potential entry level; it is located at 10% of the triangle’s base width below the lower border. The green line, which is located at 100% of the same distance, is going to be my take-profit level. I will set my stop-loss to the high of the breakout candlestick. If that candlestick will have the bigger part of its body outside the triangle, I will set my stop-loss to the high of the preceding candlestick. Symmetrical triangle is a trend continuation pattern, so I will ignore bullish breakouts in this setup. You can click on the chart to see a larger version:

I have built this chart using the ChannelPattern script. You can download my MetaTrader 4 chart template for this EUR/USD pattern. You can trade it using my free Chart Pattern Helper EA.
If you have any questions or comments regarding this symmetrical triangle on the EUR/USD chart, please feel free to submit them via the form below.