The decline of the New Zealand dollar versus the Australian dollar dragged the currency pair at the resistance of an established descending trend.
Long-term perspective
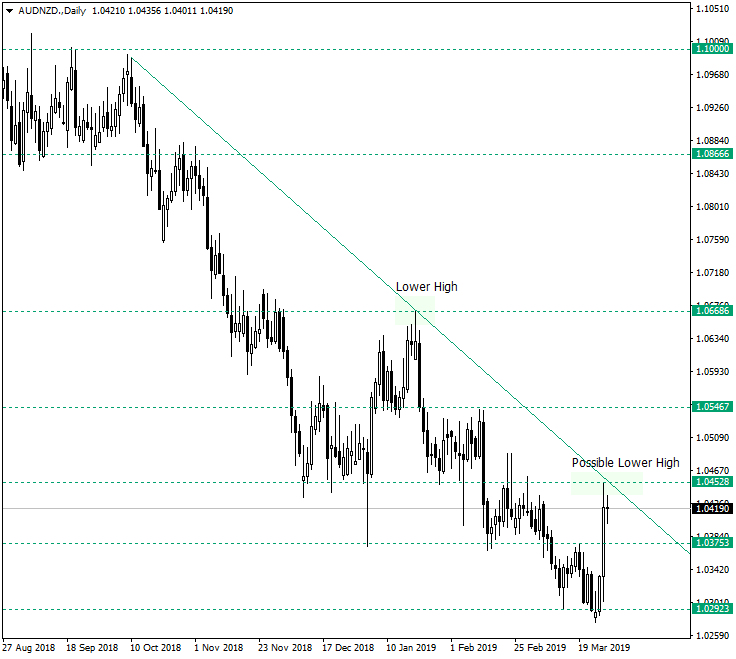
After the New Zealand dollar depreciated, following the RBNZ dovish tone, the price got under the important resistance zone made up by the 1.04528 level and the trend-line of the descending trend which started around the 1.10 level, on October 10, 2018. Along its way from 1.10, the price consolidated five intermediary levels: 1.0866, 1.0668, 1.0548, 1.0452 and 1.0375. The second and the third crossing the trend-line at the peaks — lower highs, respectively — of the trend: January 21, 2019, and March 27, 2019. Of course, if the latter date is or is not a new lower high is a subject open to debate, as the price could confirm this area as resistance or could, very well, pierce it and go for the next resistance, which is at 1.0546. So, as long as the price sits under this area, chances are that the bears will push the pair lower, towards the next support area, 1.0375. The same outcome is valid for a false break of the same double resistance. The piercing of 1.0375 will open the door to 1.0292, but it is wise to take into consideration the possibility that 1.0375 will serve as a support. In this case, an inverted head and shoulders pattern could materialize, where the February 14 and 15, 2019 lows represent the first shoulder, the rally from 1.0292 make up the head, and the supportive 1.0375 area completes the second shoulder.
Short-term perspective
The long bullish candle, in which the fundamental event was consumed, is followed by what appears to be an angled rectangle pattern. This kind of pattern signals a continuation and, as it is preceded by an appreciation — the long bullish candle — could very well send the price to 1.0452 and then to 1.04877. Note that the latter level could be met with a lot of optimism from the bears. On the other hand, if the price breaks the resistance of this pattern only to remain under 1.0430, then the validity of it and its signal will be rendered as weak and, as a consequence, more bearish pressure is to be expected.
Levels to keep an eye on:
D1: 1.0668 1.0548 1.0452 1.0375 1.0293

H1: 1.0487 1.0452 1.0398 1.0367
If you have any questions, comments, or opinions regarding the Technical Analysis, feel free to post them using the commentary form below.