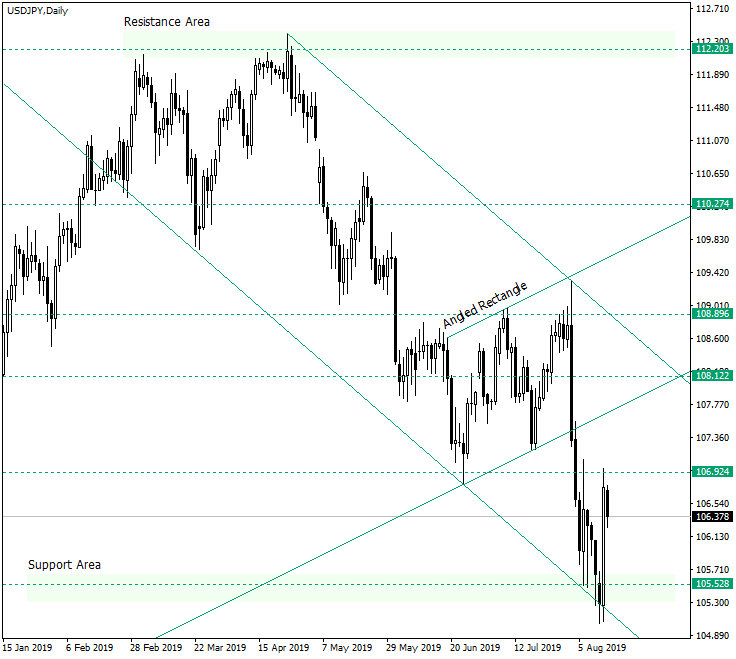
The US dollar versus the Japanese yen currency pair retraced shapely from the important support area of 105.50 and reached the previous resistance level of 106.92. There are several possibilities in the books for the upcoming time.
Long-term perspective
From 112.20 the price is in a descending trend. Along the way it is embossed by important levels like 105.52 which ended the impulse started from 108.89, 106.92 which is the starting point of the previous consolidation phase that took the form of a angled rectangle and also fueled further decline after it has been confirmed as resistance on August 6, 2019, 108.12 which serves as support earlier, and 108.89 which sparkled the descend after it has been falsely pierced, on August 01, 2019.
The fact that the price was repelled by 105.52, a level that is also an important support area from the weekly perspective, gives reasons to believe that a new impulse in the direction of the daily trend might have to wait. Because the price already confirmed the 106.92 level as resistance for twice now (on August 6 and August 13, 2019), it needs a new reason for why it should decline from this area.
In this case, a fist possibility would be the formation of a consolidation pattern that is limited by the 106.92 level and extends towards the upper line of the declining channel, with the purpose of confirming the latter as resistance. Another possibility is to falsely pierce 106.92 and thus get the chance to confirm the resistance of the channel. A more extreme scenario would be the confirmation of the double resistance etched by — yet again — the upper line of the descending channel and the 108.12 level. All these point to 105.52 as an intermediary target and to 103.00 as a prime target.
As long as the price finds itself under 108.89, the downwards movement is expected to continue.
Short-term perspective
The price retraced and confirmed as resistance the 107.00 psychological level (107.08 on the chart) and the 38.2 Fibonacci retracement level. This could allow an extension of the decline until the 23.6 level or 11.4, which corresponds to 105.51.
From one of the two levels, the price has a chance to reach 107.55, which corresponds to the 61.8 retracement level. This would be a last standing point for the bears, and also coincides with the scenario of the false piercing of 106.92 on the daily chart.
Levels to keep an eye on:
D1: 105.52 106.92 108.12 108.89

H4: 105.71 107.08 107.55 and the Fibonacci retracement levels
If you have any questions, comments, or opinions regarding the US Dollar, feel free to post them using the commentary form below.