
EUR/USD
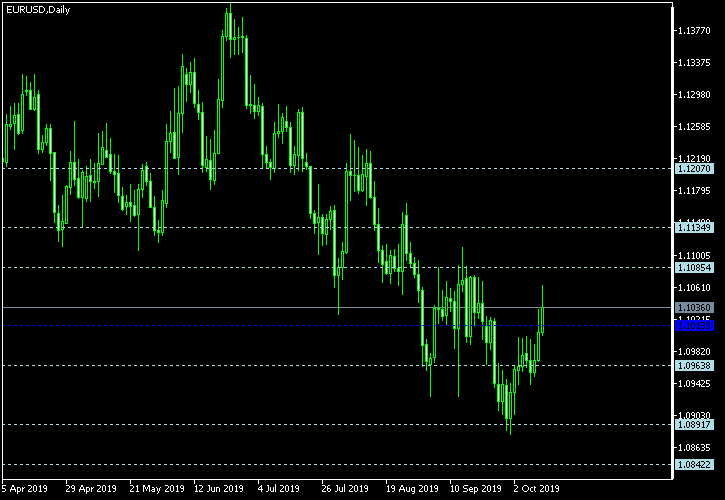
Floor pivot points
| 3rd Sup |
2nd Sup |
1st Sup |
Pivot |
1st Res |
2nd Res |
3rd Res |
|
| 1.0842 |
1.0892 |
1.0964 |
1.1013 |
1.1085 |
1.1135 |
1.1207 |
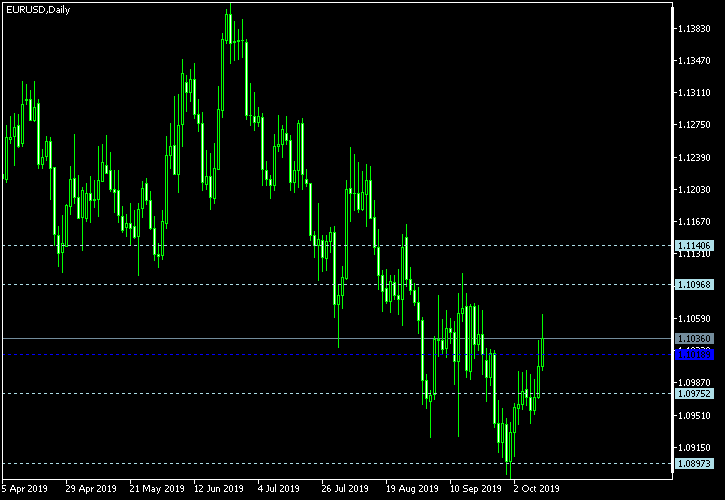
Woodie’s pivot points
| 2nd Sup |
1st Sup |
Pivot |
1st Res |
2nd Res |
| 1.0897 |
1.0975 |
1.1019 |
1.1097 |
1.1141 |
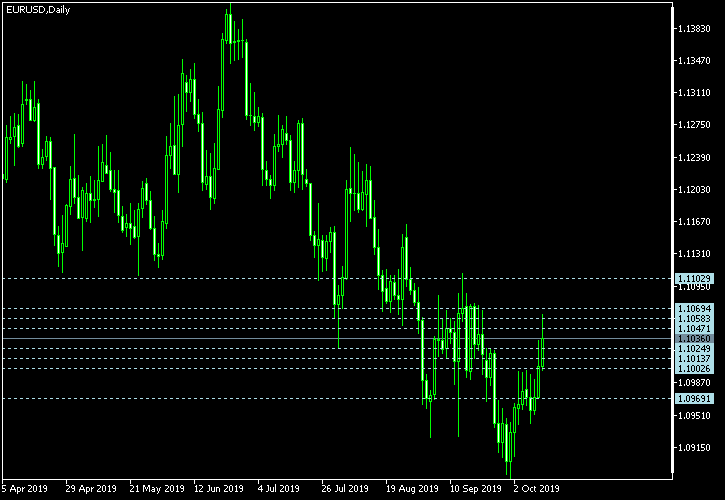
Camarilla pivot points
| 4th Sup |
3rd Sup |
2nd Sup |
1st Sup |
1st Res |
2nd Res |
3rd Res |
4th Res |
| 1.0969 |
1.1003 |
1.1014 |
1.1025 |
1.1047 |
1.1058 |
1.1069 |
1.1103 |
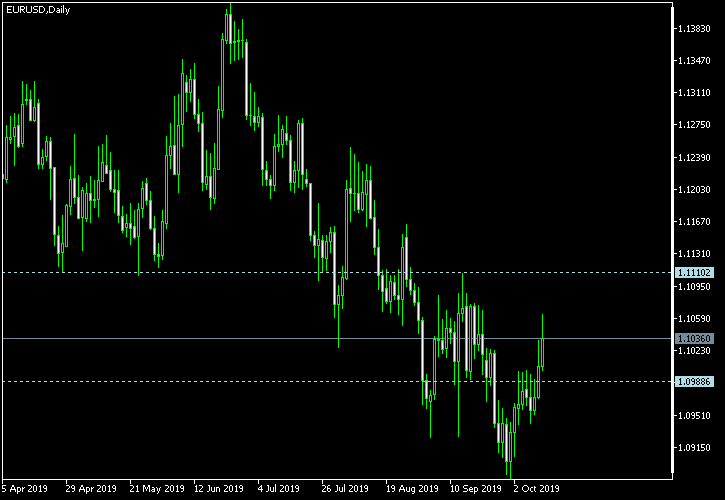
Tom Demark’s pivot points
| Support |
Resistance |
| 1.0989 |
1.1110 |
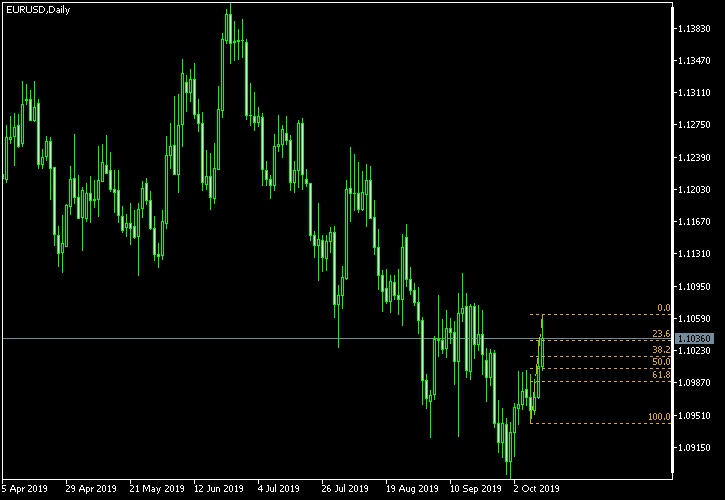
Fibonacci retracement levels
| 0.0% |
23.6% |
38.2% |
50.0% |
61.8% |
100.0% |
| 1.0941 |
1.0970 |
1.0988 |
1.1002 |
1.1016 |
1.1063 |
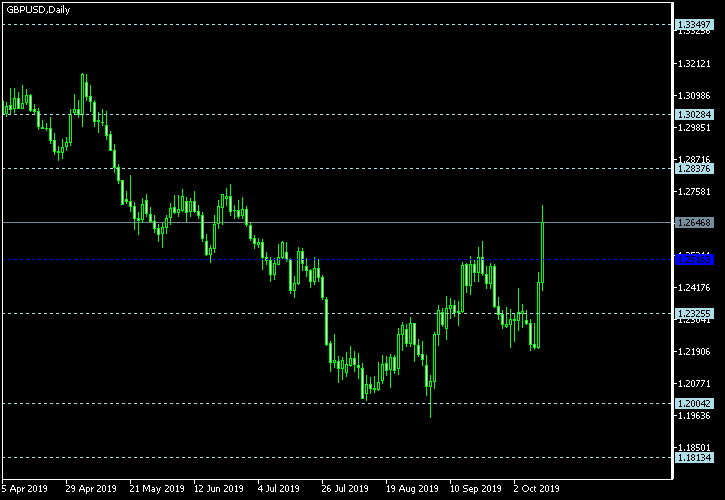
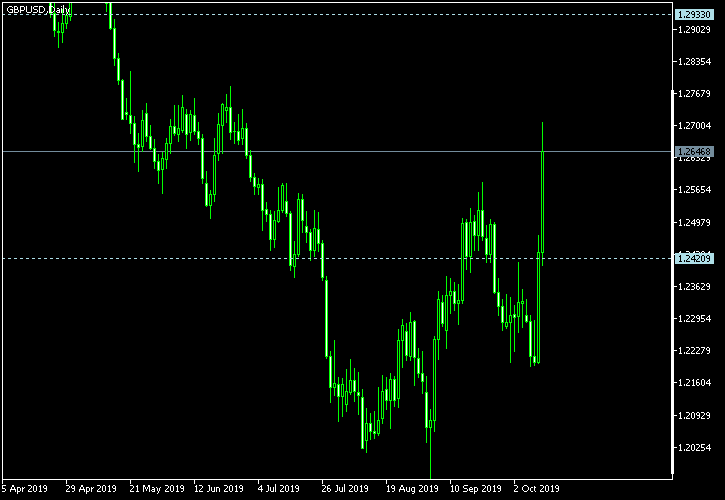
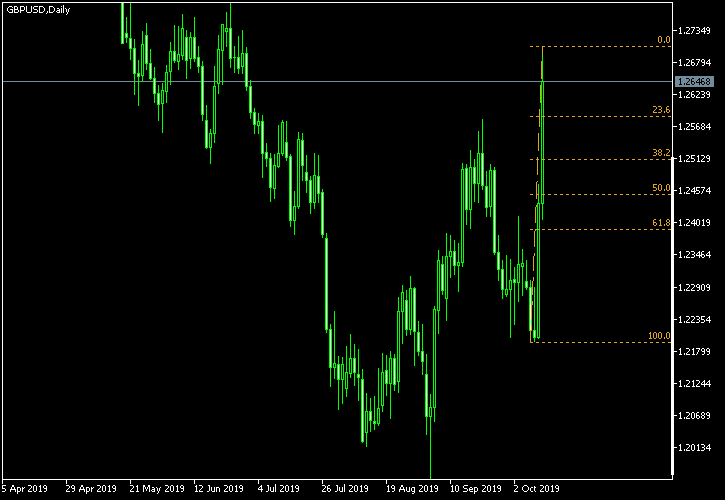
GBP/USD
Floor pivot points
| 3rd Sup |
2nd Sup |
1st Sup |
Pivot |
1st Res |
2nd Res |
3rd Res |
|
| 1.1813 |
1.2004 |
1.2326 |
1.2516 |
1.2838 |
1.3028 |
1.3350 |
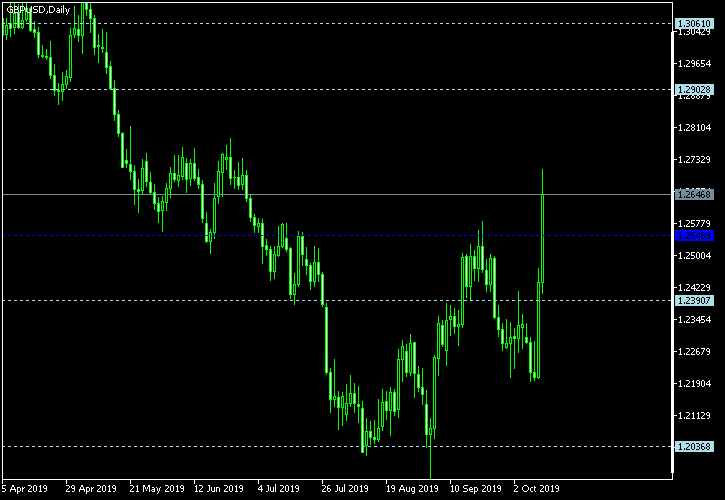
Woodie’s pivot points
| 2nd Sup |
1st Sup |
Pivot |
1st Res |
2nd Res |
| 1.2037 |
1.2391 |
1.2549 |
1.2903 |
1.3061 |
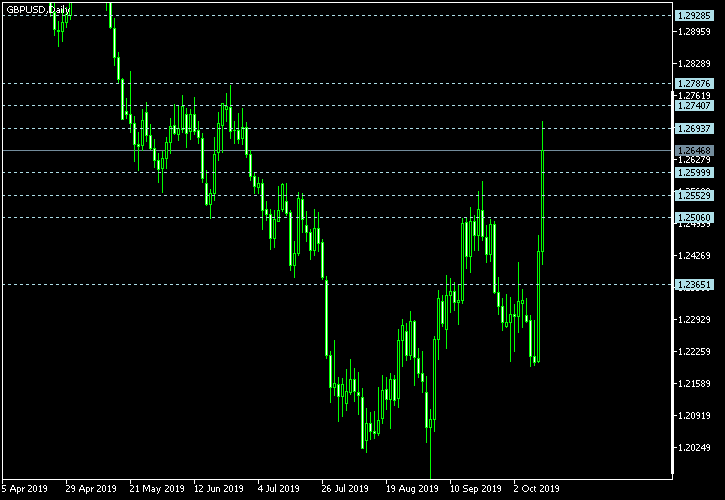
Camarilla pivot points
| 4th Sup |
3rd Sup |
2nd Sup |
1st Sup |
1st Res |
2nd Res |
3rd Res |
4th Res |
| 1.2365 |
1.2506 |
1.2553 |
1.2600 |
1.2694 |
1.2741 |
1.2788 |
1.2928 |
Tom Demark’s pivot points
| Support |
Resistance |
| 1.2421 |
1.2933 |
Fibonacci retracement levels
| 0.0% |
23.6% |
38.2% |
50.0% |
61.8% |
100.0% |
| 1.2195 |
1.2316 |
1.2391 |
1.2451 |
1.2511 |
1.2707 |
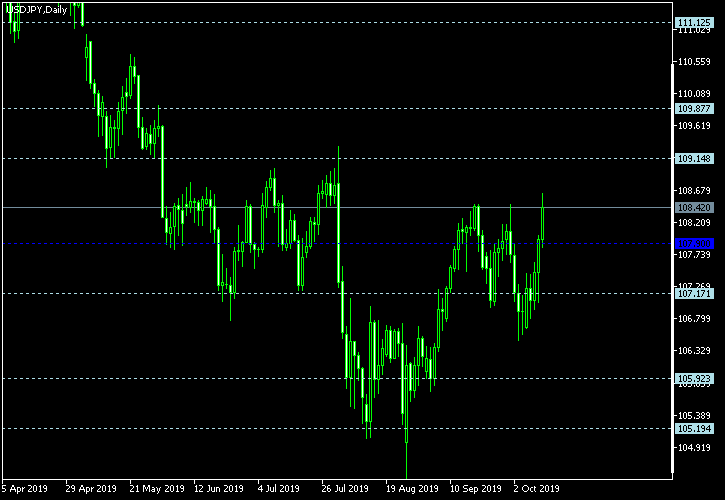
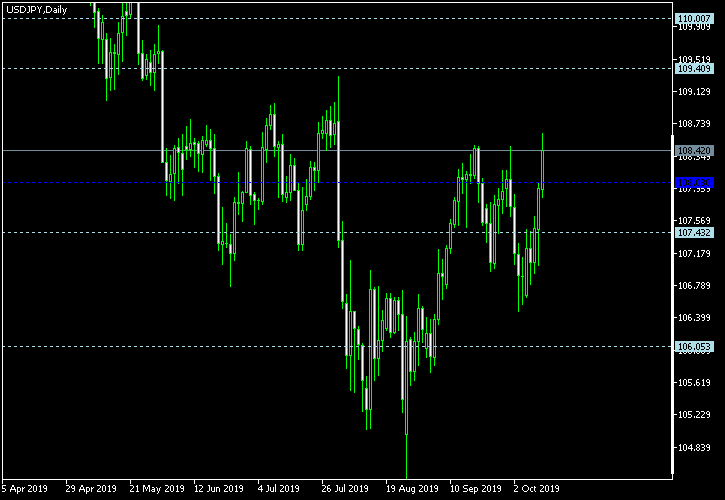
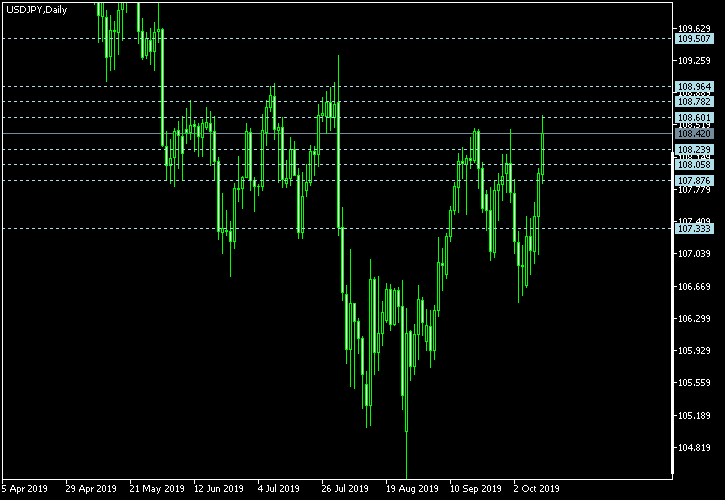
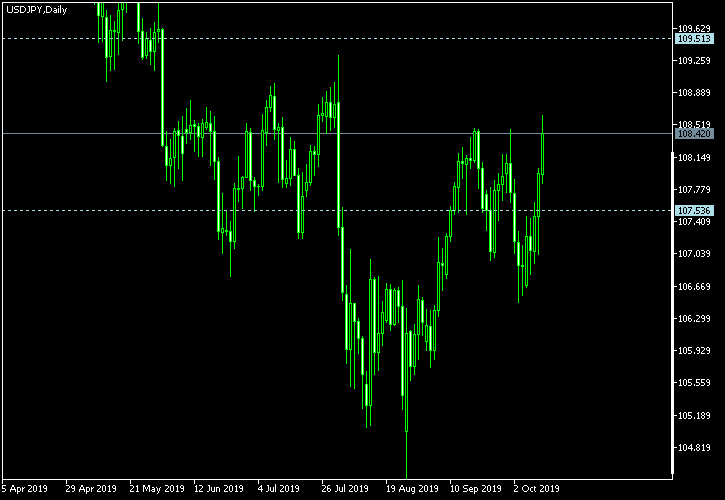
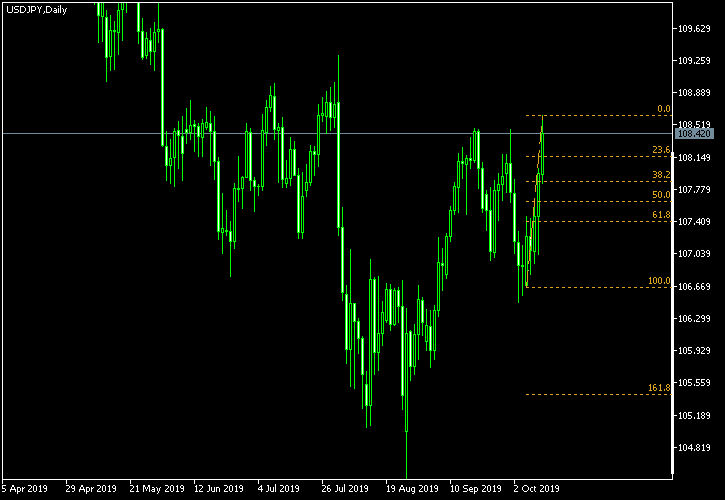
USD/JPY
Floor pivot points
| 3rd Sup |
2nd Sup |
1st Sup |
Pivot |
1st Res |
2nd Res |
3rd Res |
|
| 105.19 |
105.92 |
107.17 |
107.90 |
109.15 |
109.88 |
111.13 |
Woodie’s pivot points
| 2nd Sup |
1st Sup |
Pivot |
1st Res |
2nd Res |
| 106.05 |
107.43 |
108.03 |
109.41 |
110.01 |
Camarilla pivot points
| 4th Sup |
3rd Sup |
2nd Sup |
1st Sup |
1st Res |
2nd Res |
3rd Res |
4th Res |
| 107.33 |
107.88 |
108.06 |
108.24 |
108.60 |
108.78 |
108.96 |
109.51 |
Tom Demark’s pivot points
| Support |
Resistance |
| 107.54 |
109.51 |
Fibonacci retracement levels
| 0.0% |
23.6% |
38.2% |
50.0% |
61.8% |
100.0% |
| 106.65 |
107.12 |
107.41 |
107.64 |
107.87 |
108.63 |
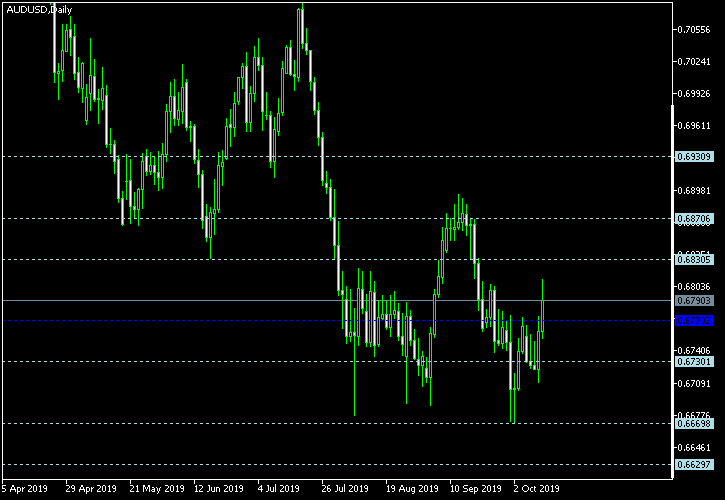
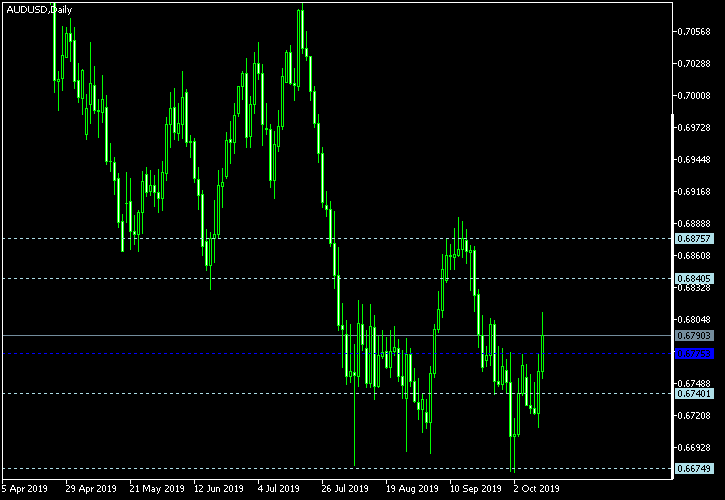
AUD/USD
Floor pivot points
| 3rd Sup |
2nd Sup |
1st Sup |
Pivot |
1st Res |
2nd Res |
3rd Res |
|
| 0.6630 |
0.6670 |
0.6730 |
0.6770 |
0.6830 |
0.6871 |
0.6931 |
Woodie’s pivot points
| 2nd Sup |
1st Sup |
Pivot |
1st Res |
2nd Res |
| 0.6675 |
0.6740 |
0.6775 |
0.6841 |
0.6876 |
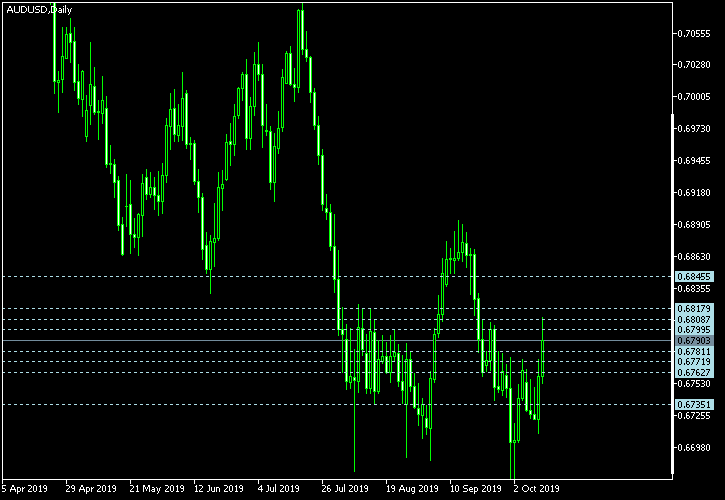
Camarilla pivot points
| 4th Sup |
3rd Sup |
2nd Sup |
1st Sup |
1st Res |
2nd Res |
3rd Res |
4th Res |
| 0.6735 |
0.6763 |
0.6772 |
0.6781 |
0.6800 |
0.6809 |
0.6818 |
0.6846 |
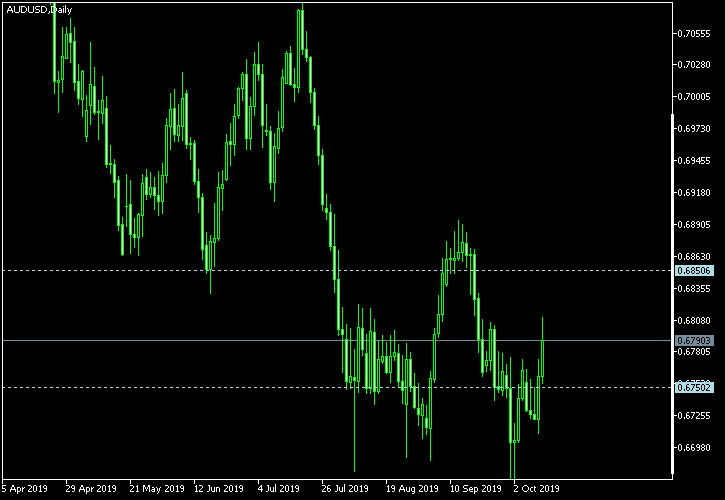
Tom Demark’s pivot points
| Support |
Resistance |
| 0.6750 |
0.6851 |
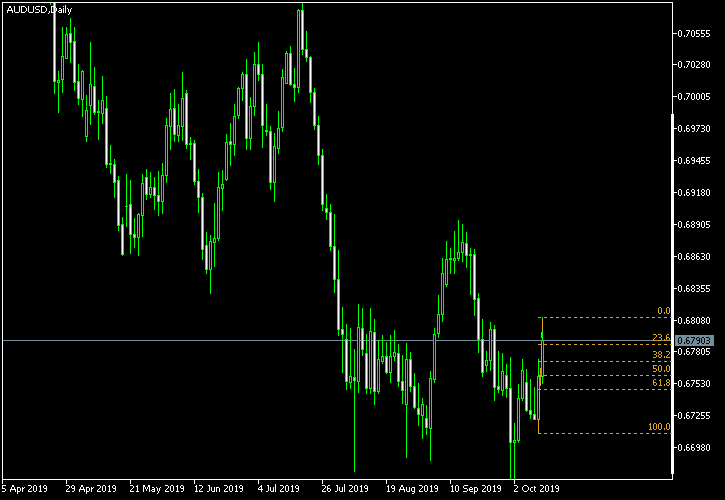
Fibonacci retracement levels
| 0.0% |
23.6% |
38.2% |
50.0% |
61.8% |
100.0% |
| 0.6710 |
0.6734 |
0.6748 |
0.6760 |
0.6772 |
0.6810 |
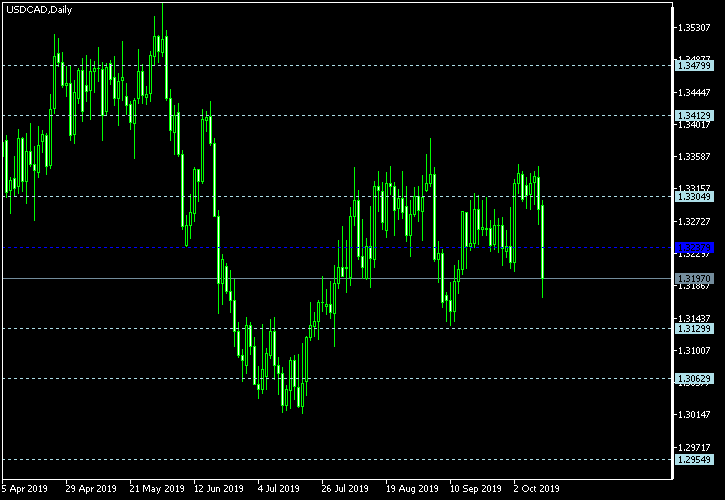
USD/CAD
Floor pivot points
| 3rd Sup |
2nd Sup |
1st Sup |
Pivot |
1st Res |
2nd Res |
3rd Res |
|
| 1.2955 |
1.3063 |
1.3130 |
1.3238 |
1.3305 |
1.3413 |
1.3480 |
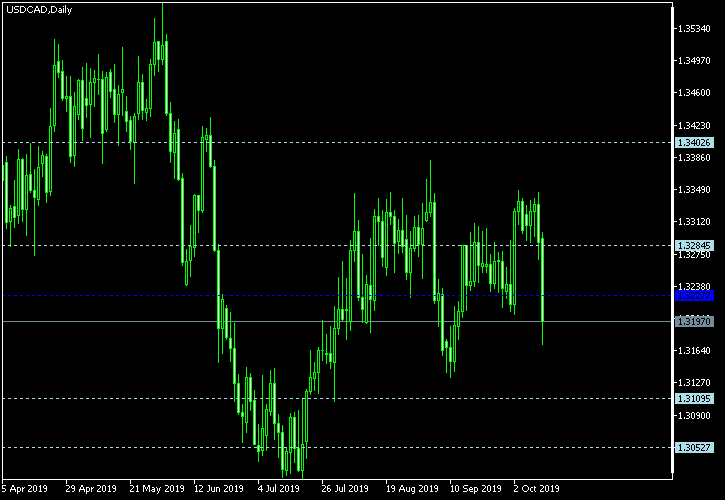
Woodie’s pivot points
| 2nd Sup |
1st Sup |
Pivot |
1st Res |
2nd Res |
| 1.3053 |
1.3110 |
1.3228 |
1.3285 |
1.3403 |
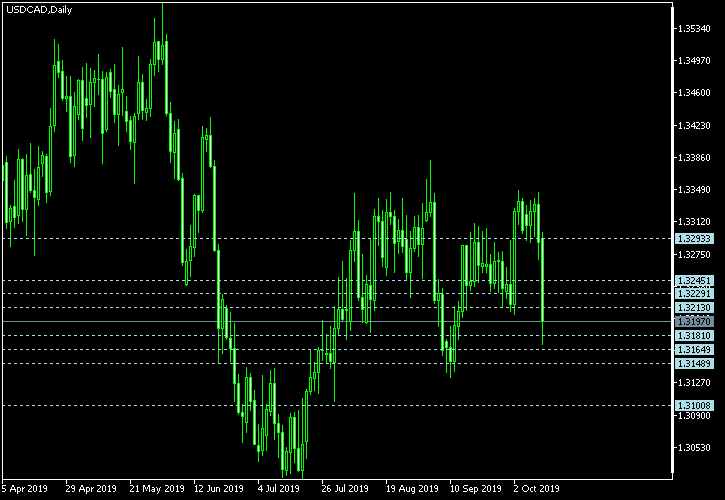
Camarilla pivot points
| 4th Sup |
3rd Sup |
2nd Sup |
1st Sup |
1st Res |
2nd Res |
3rd Res |
4th Res |
| 1.3101 |
1.3149 |
1.3165 |
1.3181 |
1.3213 |
1.3229 |
1.3245 |
1.3293 |
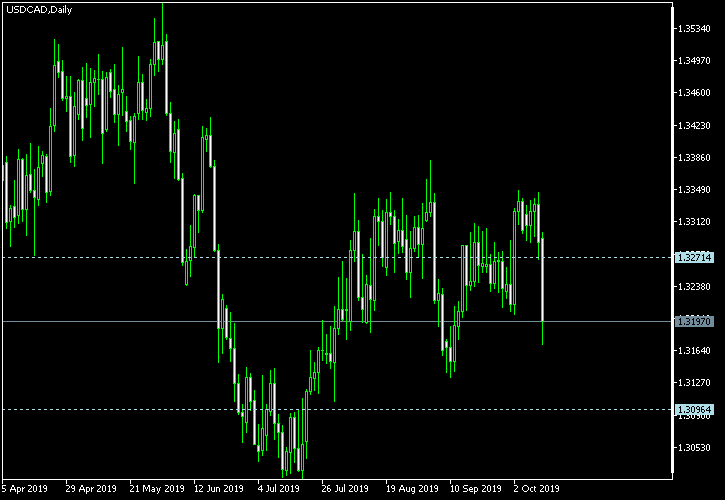
Tom Demark’s pivot points
| Support |
Resistance |
| 1.3096 |
1.3271 |
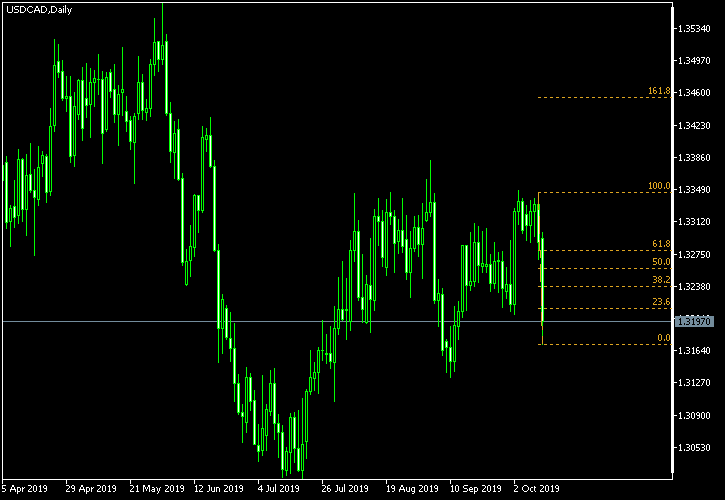
Fibonacci retracement levels
| 0.0% |
23.6% |
38.2% |
50.0% |
61.8% |
100.0% |
| 1.3171 |
1.3212 |
1.3238 |
1.3258 |
1.3279 |
1.3346 |
If you have any questions or comments on this technical analysis, please feel free to reply below.