
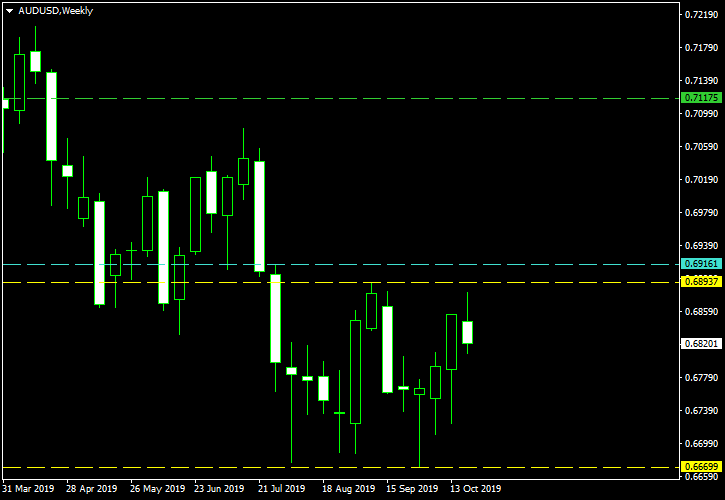
The long-term downtrend seen on the weekly chart of the AUD/USD currency pair is extending since January 2018. Starting from late July 2019, the pair is consolidating in a formation that now resembles a double bottom pattern. A successful bounce from the second local low can lead to a strong upside wave with a potential for a long entry.
The chart below shows the pattern’s neckline and the two bottoms marked with the yellow lines. The cyan line marks my entry level situated at 10% of the pattern’s height above the neckline. I will place my take-profit at the level marked with the green line, which is situated at 100% of the pattern’s height from the neckline. I will set my stop-loss to the low of the breakout candle or to the low of the preceding one if the breakout candle is trading mostly above the neckline. I won’t enter short positions in this setup, which is intrinsically a bullish one. You can click on the image below to see a full-size screenshot:
I have built this chart using the ChannelPattern script. You can download my MetaTrader 4 chart template for this AUD/USD pattern. You can trade it using my free Chart Pattern Helper EA.
If you have any questions or comments regarding this double bottom on the AUD/USD chart, please feel free to submit them via the form below.