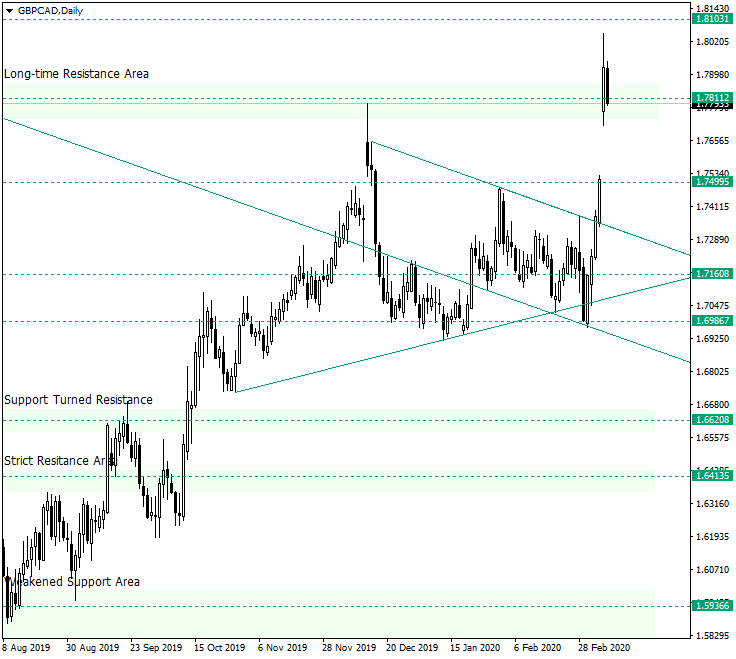
The Great Britain pound versus the Canadian dollar currency pair gapped above the important long-time resistance area of 1.7811.
Long-term perspective
After confirming the weakened support area of 1.5936, the price started to move upward, passing two important levels, 1.6413 and 1.6620, respectively and confirming 1.7811 as resistance. After that, it went into a consolidation phase that began to look very alike a symmetrical triangle but towards its end behaved as an angled rectangle. Irrespective of which of the chart patterns materialized, the market played out the message very well, as it directed the price pass the resistance trend line of the triangle (or angled rectangle, respectively).
The week commenced with a gap that sent the price above the 1.7811 important level. The candle on March 9 appreciated and almost touched the next resistance level, 1.8103.
Today’s candle, if it were to close now, would look like a dark cloud cover candlestick pattern. O course, it is way too soon to debate such a possibility, plus that, by the end of the day, it could turn out to be a hanging man, for example. However, another amendment would be that the bearish pattern forms above a major support area, the latter, thus, invalidating the possible pattern.
So, as long as the price sits above 1.7811, the advancement towards higher prices cannot be ruled out, targeting 1.8103. The price could also try to revisit lower prices, but the bulls should be guarding the level, sending the price back over 1.7811.
However, if the price manages, on a daily close basis, to remain under 1.7811, then, with or without the aforementioned discussed bearish candlestick pattern, the bears could try and push the price towards 1.7499. This would not necessarily mean that the bulls lost control. It would be a technical development purposed to close the gap, hence preparing a possible leap up from 1.7499.
Short-term perspective
The price is in a consolidation phase, limited by the support of 1.7727 and the resistance of 1.8047. So, as long as the support holds, the resistance area is the prime target for bullish endeavors.
The price could slip beneath the support to close the gap. On the other hand, it is also possible for the gap to be only partially closed, as the price pierces 1.7727, confirms 1.7609 as support, and retraces above 1.7727.
The bullish scenario may be at risk only if the price establishes beneath 1.7481. If the bears make it until here, they should still consider the fact that they would have closed the gap and as a result a strong bullish pressure may follow.
Levels to keep an eye on:
D1: 1.7811 1.8103 1.7499

H4: 1.7727 1.8047 1.7609 1.7481
If you have any questions, comments, or opinions regarding the Technical Analysis, feel free to post them using the commentary form below.