The Australian dollar versus the New Zealand dollar currency pair reached a very important support area. Is possible to see a bullish comeback from here?
Long-term perspective
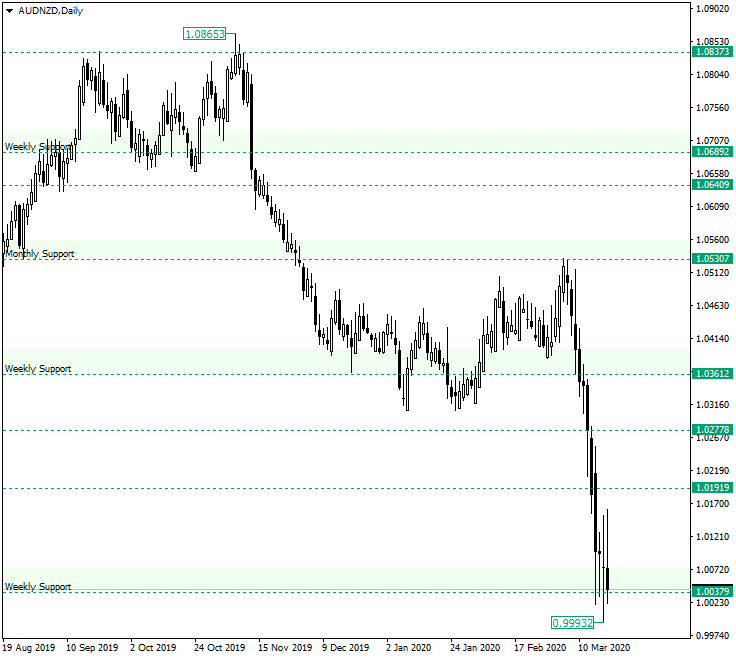
After the confirmation as a resistance of the 1.0837 level, which left behind the peak of 1.0865, the price declined until the next support area, 1.0361 — a weekly level.
After a consolidative phase, the price resumed the fall, piercing the support and reaching the next important support area, the weekly level of 1.0037, respectively.
The price is now printing candles with small bodies and long tails, as it did for the candles on March 17 and 18, respectively. These candles show either a lack of direction (usually as a result of consolidation) or a possible turning point.
Given these facts, the possible scenarios are as follows. The first one is the one in which the price oscillates above the level of 1.0037, without getting near the resistance of 1.0191. This can lead to two possible outcomes. The first possibility is to see a piercing of the support and a day closing under it — and preferably under the low of 0.9993. If this happens, then the next target would be represented by the psychological level of 0.9900. On the other hand, another possible unfolding is to see a false break of the support. The situation would be even better for the bulls if the price manages — before it retraces back above the support — to take out the low of 0.9993 — by creating a lower low. This would allow an appreciation that targets 1.0191.
The second scenario is the one in which, with or without a false piercing of the support, the price oscillates between the support of 1.1037 and the resistance of 1.0191. This would lead to range trading, but noteworthy is that, because of the strong bearish market, the support could be the one that gives up first.
Short-term perspective
The price is in a descending movement, as the trendline clearly shows. The oscillations are limited by the support of 1.0024 and the resistance of 1.0150.
If the price manages to confirm the double resistance, made possible by the resistance level and the trendline, then the first target is represented by the support level. If the level gets pierced and confirmed as resistance, the second target is represented by the 0.9950 level — not highlighted on the chart.
But if the price manages to turn the double resistance into a support area, then an appreciation that reaches 1.0282 is in the cards.
Levels to keep an eye on:
D1: 1.0037 1.0191

H4: 1.0024 1.0150 1.0282
If you have any questions, comments, or opinions regarding the Technical Analysis, feel free to post them using the commentary form below.