The Great Britain pound versus the Canadian dollar currency pair seems to be underpinned by the bulls. Can they reach 1.7445?
Long-term perspective
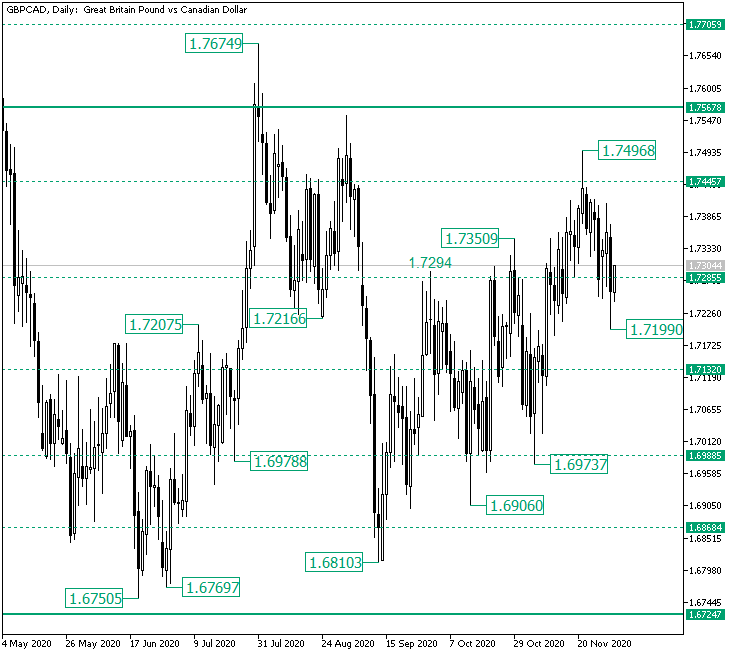
The fall from the 1.7674 high extended until the 1.7216 low and then following the second failed attempt — on September the 1st — to conquer the firm level of 1.7567, prolonged to the 1.6810 dip.
However, the bulls pulled themselves together and started an ascending movement that — as of writing — has only one barrier to overcome until it reaches 1.7568 once again, the intermediate level of 1.7445.
Still, conquering 1.7445 requires the price to get there, which, in turn, needs a support area from where to start the rise. One such area could be played by the 1.7285 level.
Now, as the ascending movement displays higher highs and lows and as one of the lows — the presumably last one — sits at 1.7199 while the price retraced around the 1.7285 zone, the bulls could start to feel conformable.
In other words, the false piercing of 1.7285, which crafted the 1.7199 low, might be just what the bulls need to start a new movement — or resume the overall appreciation that debuted at 1.6810 — that, by their expectations, will render 1.7445 as support. If this happens, then 1.7567 is the next bullish objective.
Nevertheless, if the price shifts direction and validates 1.7285 as resistance, then 1.7132 could be the next target.
Short-term perspective
After the price validated 1.6965 as support, the bulls took their chance to plot on the chart an ascending trend. And so they did, as they reached the 1.7487 level and started a correction after etching the 1.7496 high.
The correction extended until the 1.7199 low, a little under the 1.7244 level. But the bulls rendered the movement as a false piercing.
Still, as long as the price is under the trendline that starts from the 1.7496 high, which could limit an angled rectangle, the bears may be expected to resume domination.
In conclusion, as long as the price oscillates above 1.7244, the first objective is represented by the double resistance area defined by the falling trendline and the 1.7337 intermediary level. If this area is cleared, then, as the falling rectangle is a continuation pattern, and since it is preceded by a rise, 1.7487 is the next stop.
On the other hand, if the 1.7199 level fails as support, with or without the validation of the double resistance, then 1.7094 is the next bearish aim.
Levels to keep an eye on:
D1: 1.7285 1.7445 1.7567 1.7132

H4: 1.7244 1.7337 1.7487 1.7199
If you have any questions, comments, or opinions regarding the Technical Analysis, feel free to post them using the commentary form below.