The recently formed
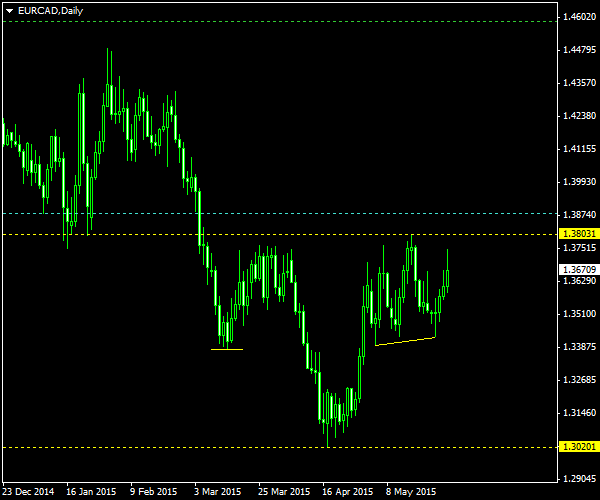
The pattern can be examined on the chart screenshot below. The neckline and the bottom of the head are marked with the horizontal dashed yellow lines. The shoulders are marked with the short yellow lines — notice how different in form the two shoulders are. The breakout trade entry is positioned at 10% of the pattern’s height above the neckline — it is marked with the cyan line. Profit target is placed at 100% of the pattern’s height above the neckline and is marked with the green line. Bottom breakout will be ignored here unless some new pattern forms (e.g. descending triangle). I will use the breakout candle’s low as my

I have built this chart using the ChannelPattern script. You can download my MetaTrader 4 chart template for this EUR/CAD pattern. You can trade it using my free Chart Pattern Helper EA.
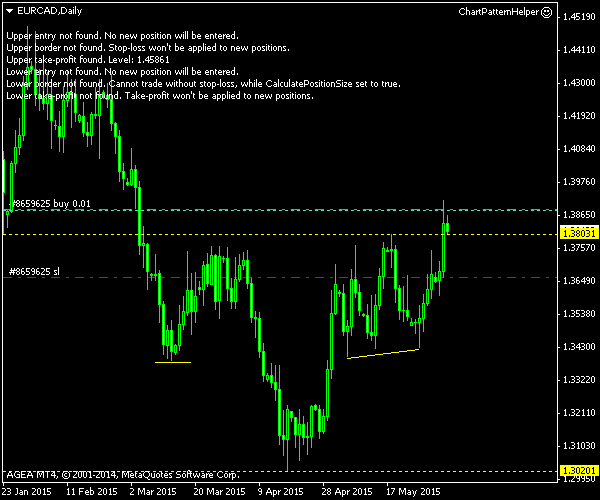
Update 2015-06-03: The bullish breakout has triggered a buy entry yesterday at 1.38844 with

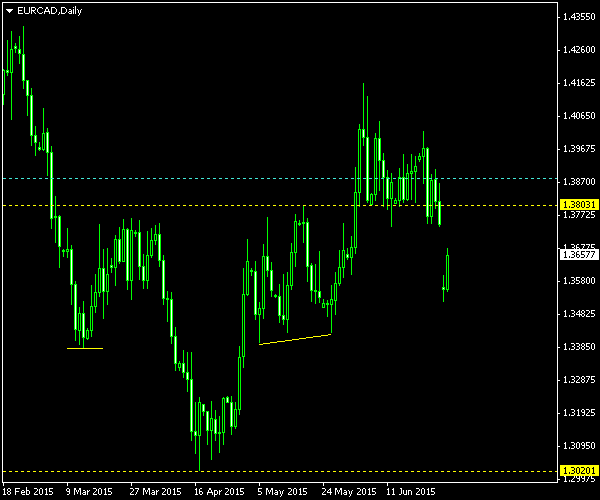
Update 2015-06-29 8:45 GMT: The breakout faded rather soon here. The currency pair traded flat for some time before being hit by “Greek shock”. Unfortunately for me, the position closed 90 pips below my intended

PS: Luckily, my other EUR trade is showing some promise now.
If you have any questions or comments regarding this reverse