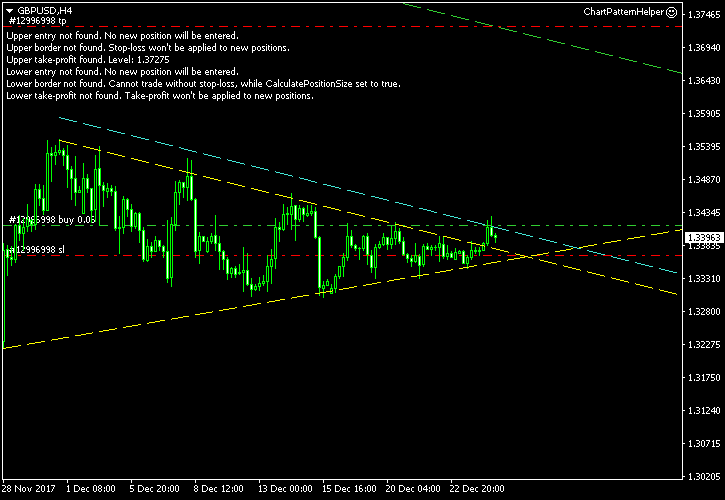
The 4-hour timeframe chart of the GBP/USD currency pair is currently showing a
If you look at the chart below, the yellow lines mark the triangle itself. The cyan line is where my own entry point will be in case of a breakout. The line is positioned with a buffer distance, which is equal to 10% of the triangle’s height at base. 100% of the height is used to set my

I have built this chart using the ChannelPattern script. You can download my MetaTrader 4 chart template for this GBP/USD pattern. You can trade it using my free Chart Pattern Helper EA.
Update 2017-12-27: The breakout occurred today at 9:47 GMT with the entry rate of 1.34147,

Update 2018-01-12 11:40 GMT: My first closed trade this year turns out to be quite lucky. GBP/USD has hit my

If you have any questions or comments regarding this symmetrical triangle on the GBP/USD chart, please feel free to submit them via the form below.