- December 21, 2020 Do we get tax benefits on Personal Loan?
- December 18, 2020 The solicitors Preston depends on for stress-free compensation claims
- December 16, 2020 eToro: History and Key Features
- December 11, 2020 Canadian Dollar Pauses 2020 Rally Against US Peer Amid Falling Crude Prices
- December 11, 2020 Pound Crashes Against Dollar As No-Deal Brexit Appears Imminent
- December 11, 2020 USD/JPY 104.57 High Starting a New Bearish Leg?
Technical Analysis
 November 26
2016
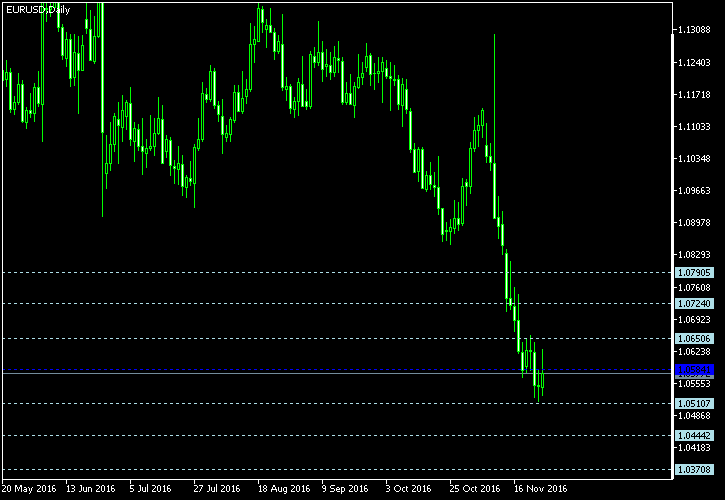
Weekly Forex Technical Analysis (Nov 28 — Dec 2)
EUR/USD Floor pivot points 3rd Sup 2nd Sup 1st Sup Pivot 1st Res 2nd Res 3rd Res 1.0371 1.0444 1.0511 1.0584 1.0651 1.0724 1.0791 Woodie’s pivot points 2nd Sup 1st Sup Pivot 1st Res 2nd Res 1.0442 1.0507 1.0582 1.0647 1.0722 Camarilla pivot points 4th Sup 3rd Sup 2nd Sup 1st Sup 1st Res 2nd […]
Read more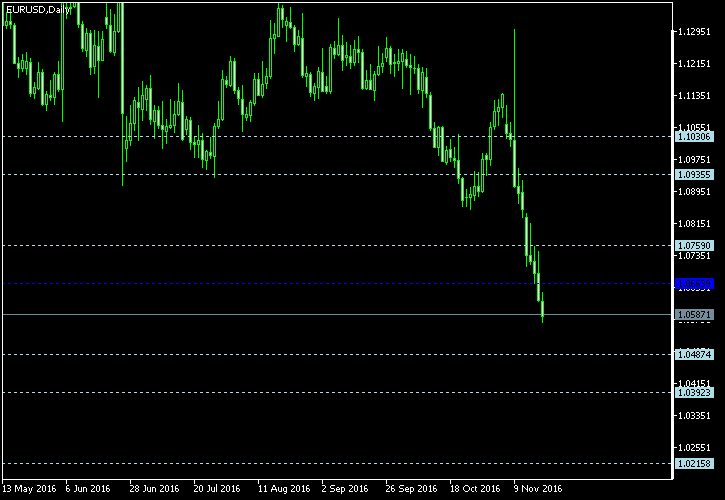 November 19
2016
Weekly Forex Technical Analysis (Nov 21 — Nov 25)
EUR/USD Floor pivot points 3rd Sup 2nd Sup 1st Sup Pivot 1st Res 2nd Res 3rd Res 1.0216 1.0392 1.0487 1.0664 1.0759 1.0935 1.1031 Woodie’s pivot points 2nd Sup 1st Sup Pivot 1st Res 2nd Res 1.0372 1.0447 1.0644 1.0718 1.0915 Camarilla pivot points 4th Sup 3rd Sup 2nd Sup 1st Sup 1st Res 2nd […]
Read more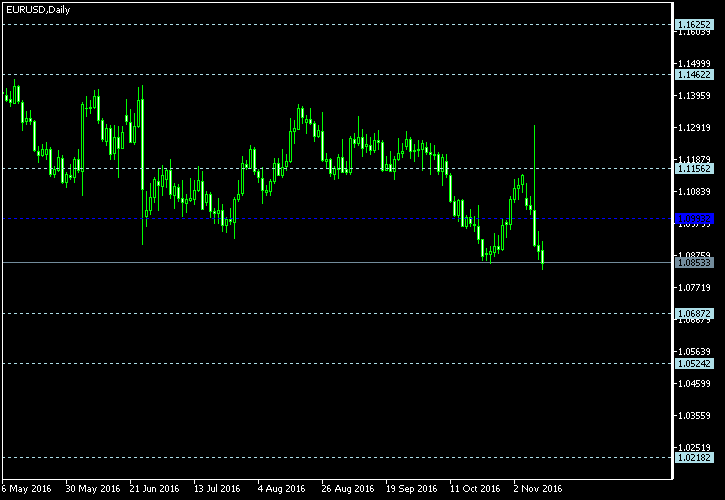 November 12
2016
Weekly Forex Technical Analysis (Nov 14 — Nov 18)
EUR/USD Floor pivot points 3rd Sup 2nd Sup 1st Sup Pivot 1st Res 2nd Res 3rd Res 1.0218 1.0524 1.0687 1.0993 1.1156 1.1462 1.1625 Woodie’s pivot points 2nd Sup 1st Sup Pivot 1st Res 2nd Res 1.0488 1.0616 1.0957 1.1085 1.1426 Camarilla pivot points 4th Sup 3rd Sup 2nd Sup 1st Sup 1st Res 2nd […]
Read more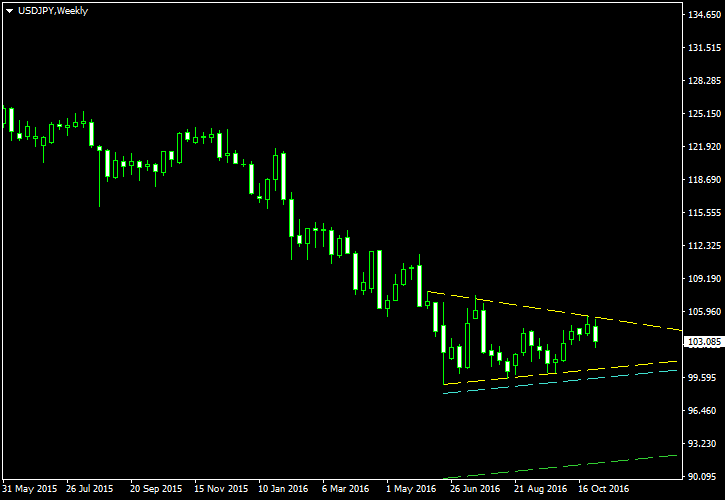 November 6
2016
Mixed Symmetrical/Descending Triangle on Weekly Chart of USD/JPY
The chart pattern we can now observe on the weekly chart of the USD/JPY currency pair is obviously a triangle. It is formed by the FX rate consolidating in a narrowing range, which follows a strong downtrend that persisted in the dollar/yen pair since June 2015 and set its lowest low in June 2016. The triangle is not strictly symmetrical, with the lower border being more horizontal than the upper one. Yet it […]
Read more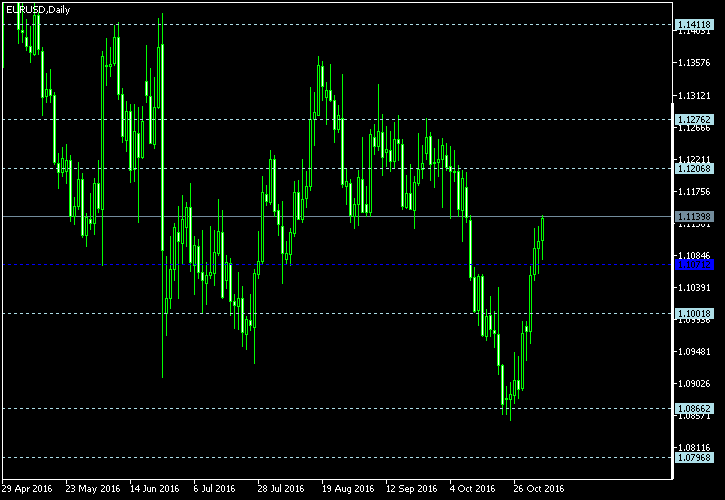 November 5
2016
Weekly Forex Technical Analysis (Nov 7 — Nov 11)
EUR/USD Floor pivot points 3rd Sup 2nd Sup 1st Sup Pivot 1st Res 2nd Res 3rd Res 1.0797 1.0866 1.1002 1.1071 1.1207 1.1276 1.1412 Woodie’s pivot points 2nd Sup 1st Sup Pivot 1st Res 2nd Res 1.0883 1.1035 1.1088 1.1240 1.1293 Camarilla pivot points 4th Sup 3rd Sup 2nd Sup 1st Sup 1st Res 2nd […]
Read more October 30
2016
History Repeating with Another Double Top on AUD/NZD @ H4
The Australian dollar is demonstrating another double top pattern on a four-hour chart versus its New Zealand counterpart. The last time such pattern appeared (in July), the trade went smoothly by the book. This time should be no different as the pattern looks even better with the only exception being a slight downward slope. The yellow lines mark the two tops of the pattern and also its sloped neckline. The cyan line is […]
Read more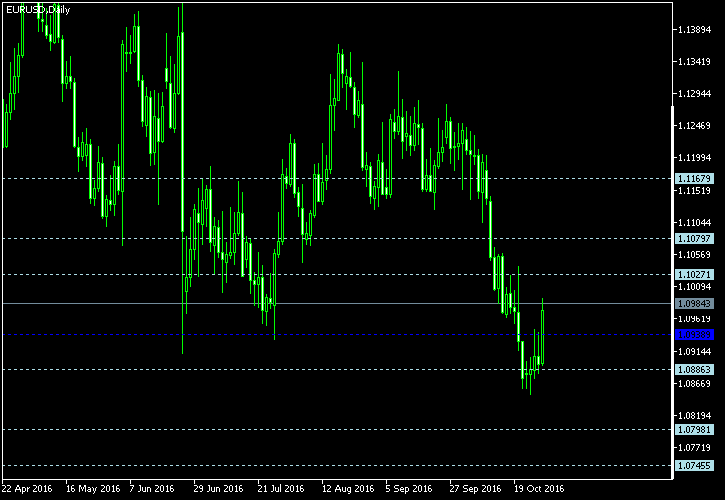 October 29
2016
Weekly Forex Technical Analysis (Oct 31 — Nov 4)
EUR/USD Floor pivot points 3rd Sup 2nd Sup 1st Sup Pivot 1st Res 2nd Res 3rd Res 1.0746 1.0798 1.0886 1.0939 1.1027 1.1080 1.1168 Woodie’s pivot points 2nd Sup 1st Sup Pivot 1st Res 2nd Res 1.0807 1.0904 1.0948 1.1045 1.1089 Camarilla pivot points 4th Sup 3rd Sup 2nd Sup 1st Sup 1st Res 2nd […]
Read more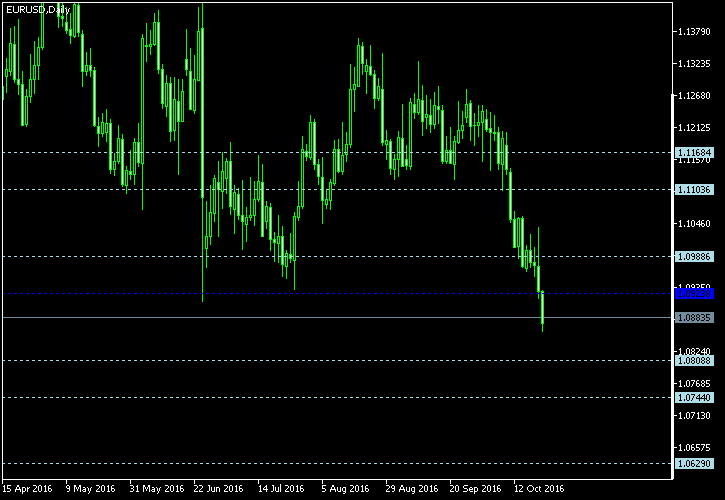 October 22
2016
Weekly Forex Technical Analysis (Oct 24 — Oct 28)
EUR/USD Floor pivot points 3rd Sup 2nd Sup 1st Sup Pivot 1st Res 2nd Res 3rd Res 1.0629 1.0744 1.0809 1.0924 1.0989 1.1104 1.1168 Woodie’s pivot points 2nd Sup 1st Sup Pivot 1st Res 2nd Res 1.0731 1.0784 1.0911 1.0964 1.1091 Camarilla pivot points 4th Sup 3rd Sup 2nd Sup 1st Sup 1st Res 2nd […]
Read more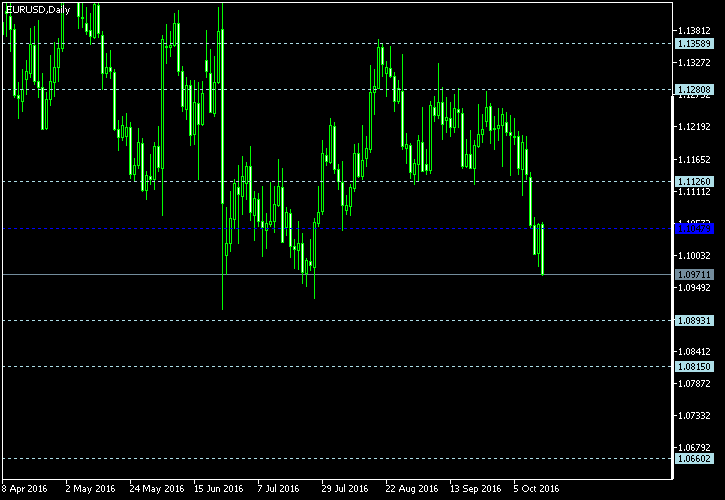 October 15
2016
Weekly Forex Technical Analysis (Oct 17 — Oct 21)
EUR/USD Floor pivot points 3rd Sup 2nd Sup 1st Sup Pivot 1st Res 2nd Res 3rd Res 1.0660 1.0815 1.0893 1.1048 1.1126 1.1281 1.1359 Woodie’s pivot points 2nd Sup 1st Sup Pivot 1st Res 2nd Res 1.0796 1.0855 1.1029 1.1088 1.1262 Camarilla pivot points 4th Sup 3rd Sup 2nd Sup 1st Sup 1st Res 2nd […]
Read more