- December 21, 2020 Do we get tax benefits on Personal Loan?
- December 18, 2020 The solicitors Preston depends on for stress-free compensation claims
- December 16, 2020 eToro: History and Key Features
- December 11, 2020 Canadian Dollar Pauses 2020 Rally Against US Peer Amid Falling Crude Prices
- December 11, 2020 Pound Crashes Against Dollar As No-Deal Brexit Appears Imminent
- December 11, 2020 USD/JPY 104.57 High Starting a New Bearish Leg?
Day: August 14, 2011
 August 14
2011
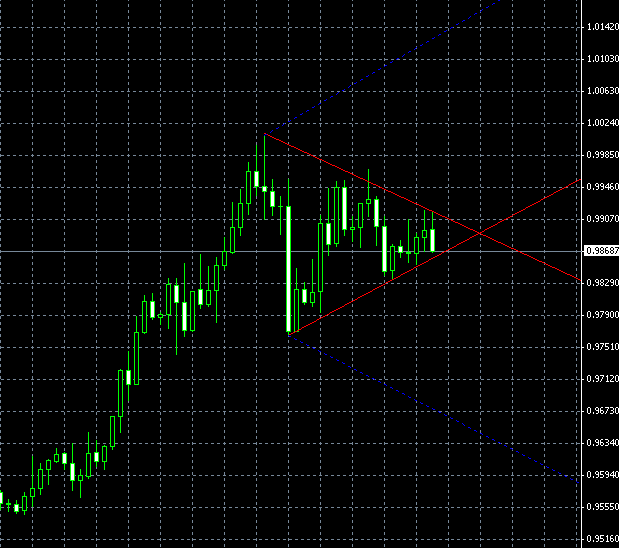
USD/CAD Symmetrical Triangles on H4 Chart
An almost flawless symmetrical triangles pattern has formed on the USD/CAD H4 chart. The current price is quite close to the pattern’s apex, signaling a prompt breakout. The previous trend is clearly bullish, hinting that the bullish breakout should be expected. In case of a bearish breakout, the pattern may not sustain itself. USD/CAD @ 1.0163 seems to be a likely target for the bullish breakout, while 0.9648 is the medium-term support level […]
Read more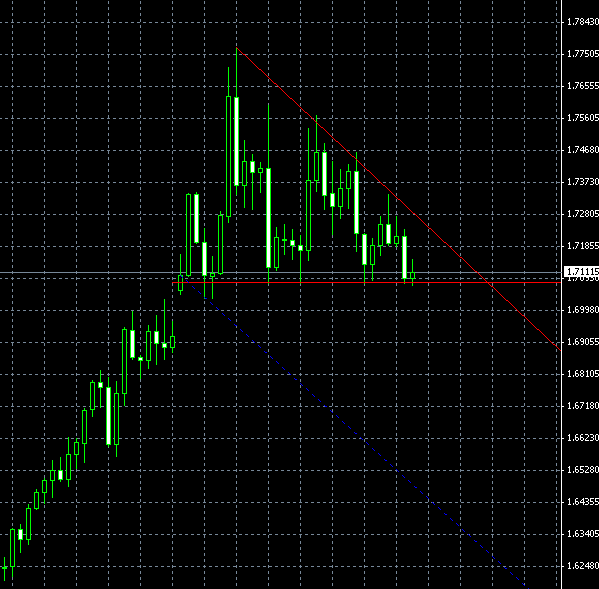 August 14
2011
EUR/NZD Descending Triangle on H4 Chart
An interesting specimen of the descending triangle pattern can be seen on the EUR/NZD H4 chart. With its top peak at 1.7769 on August 9, the pattern spans from August 8 till August 12. The bottom of the triangle is formed near 1.7080 rate. There are only few H4 bars left till the apex, so the pattern is almost ready for a breakout. The problem with this descending triangle is that […]
Read more