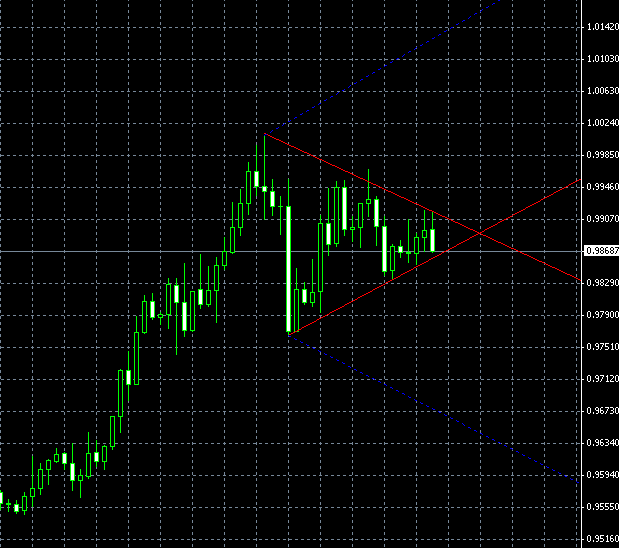
An almost flawless symmetrical triangles pattern has formed on the USD/CAD H4 chart. The current price is quite close to the pattern’s apex, signaling a prompt breakout. The previous trend is clearly bullish, hinting that the bullish breakout should be expected. In case of a bearish breakout, the pattern may not sustain itself. USD/CAD @ 1.0163 seems to be a likely target for the bullish breakout, while 0.9648 is the

If you have any questions or comments regarding this EUR/USD chart pattern, please feel free to reply via the form below.