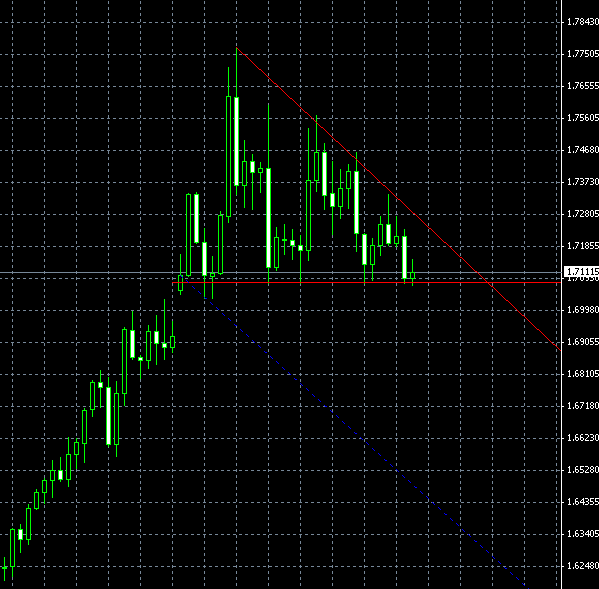
An interesting specimen of the descending triangle pattern can be seen on the EUR/NZD H4 chart. With its top peak at 1.7769 on August 9, the pattern spans from August 8 till August 12. The bottom of the triangle is formed near 1.7080 rate. There are only few H4 bars left till the apex, so the pattern is almost ready for a breakout. The problem with this descending triangle is that it’s finalizing an upward trend, while a classical descending triangle is a continuation pattern for a bearish trend. Trading this one could be unusually risky. I’d set my target to about 1.6300 for a bearish breakout and my

If you have any questions or comments regarding this EUR/NZD chart pattern, please feel free to reply via the form below.