
Contents
- 1 What Is Point-and-Figure?
-
2 Software P&F Solutions
- 2.1 Non-MetaTrader Solutions
-
2.2 MetaTrader Solutions
- 2.2.1 MT4
- 2.2.2 MT5
- 2.3 Paid Options
-
3 Books
- 3.1 Free
- 3.2 Paid
- 4 Conclusion
What Is
At first, such charts may seems strange and alien to a currency trader, but
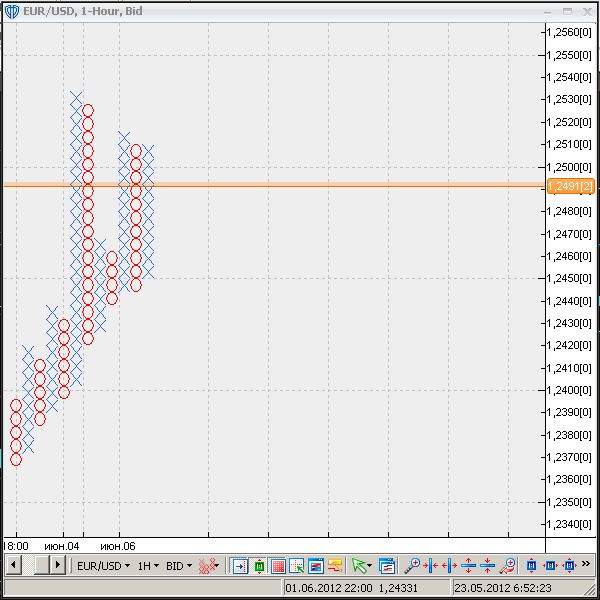
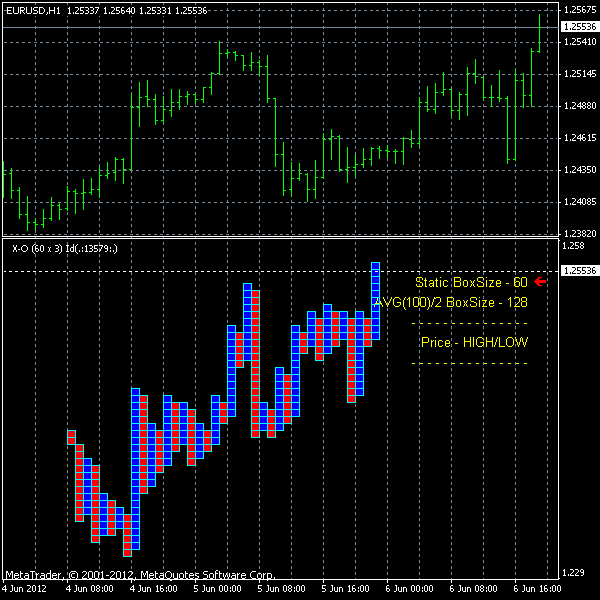
To start drawing a P&F chart, first, it is necessary to decide the box size — the price change that would be big enough to draw as either X or O on the chart. Usually, the box size is chosen as 10 pips in Forex trading. Of course, any box size can be used — 6, 50, 100 or even 1,000 pips. The bigger is the box size more filtered the P&F chart will be and less movements it will contain. The smaller is the box less filtered becomes the price and more price movements get pictured on the chart.
Once the size of the box is chosen, the starting point is decided can the drawing can be started. When the price goes up 10 pips up (let us consider the box size = 10) an X can be drawn on the chart. When the price goes up another 10 pips, a new X is drawn on top of the first one and so on. If the price fluctuates within 10 pips, nothing is drawn on the chart. As you see, the filtering power of the method is obvious. To draw a bearish movement, it would be necessary to put an O for every 10 pips that the price goes down.
In addition to the box size, another important parameter is chosen by a trader — reversal size. The reversal size is the number of boxes that the price has to go against the current movement to end it and to start drawing a new one in the opposite direction. The reversal size of 3 and 4 is quite common but any integer number equal or greater than 1 can be chosen as the reversal size.
Let us consider the reversal size = 3. If the bullish movement (a column of ascending X’s) is currently being drawn, then to qualify for a reversal, the price has to go down
The process continues ad infinitum. As a result, a trader sees a lot of X’s and O’s plotted on the chart — they represent the price changes in pure form and can still be analysed with the conventional technical analysis tools, for example — chart patterns. You can scroll down to see several examples of the P&F charts plotted in different FX trading software.
Software P&F Solutions
Only 4% of this blog’s readers prefer using
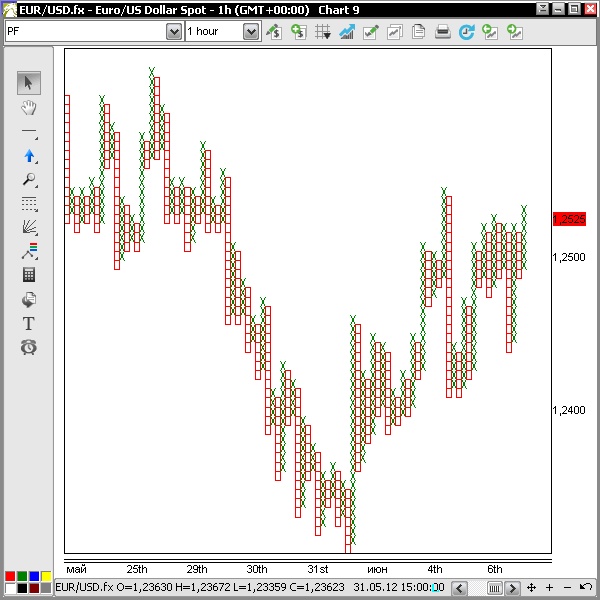
DealBook 360 from GFT Forex offers rather simple way to show P&F charts. No time data is displayed on the chart but the box/reversal size customization is available. The program can also calculate the optimal box size depending on the symbol trading range. The interface is a bit confusing but nothing too complex.
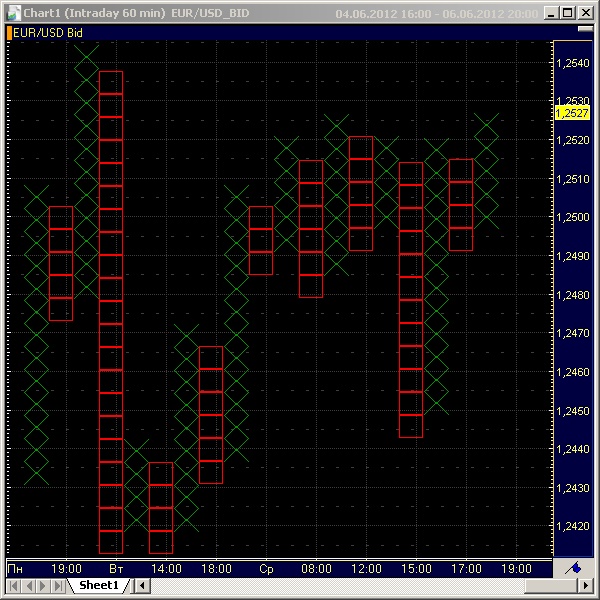
FX AccuCharts presented by FX Solutions is not much different from DealBook 360 in terms of P&F charting: the same customization options are usable, no info about time on the chart and almost the same degree of ugliness of the plotted graphics. At the same time, the interface for P&F seemed a bit friendlier here.
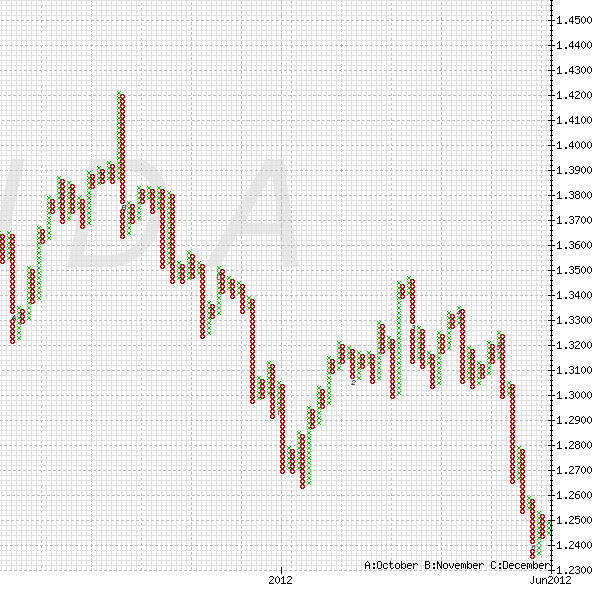
Strategy Trader by FXCM provides a simpler interface than the first two listed solutions but does not offer an option to scale the box size automatically. Other than that, it is a fast way to get a
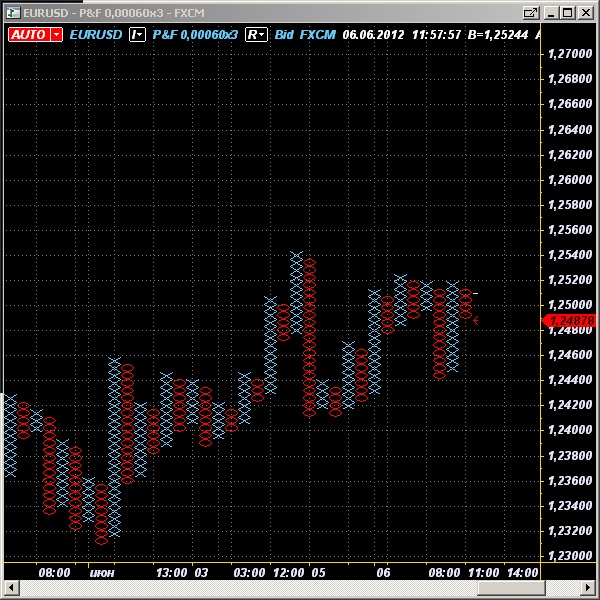
VT Trader developed by Visual Trading Systems and provided by CMSFX has a rather strange interface but offers at least some date/time indications for their P&F charts. The chart settings are customizable but there is no ‘auto’ size calculation for the
MetaTrader Solutions
MT4
Unfortunately, only MT4 solutions are currently available here. This will probably change soon as the popularity of MQL5 grows alongside the expansion of the fifth version of MetaTrader to major brokers and new traders. Here is an overview of several free P&F charting indicators for MetaTrader 4.
Cute Point & Figure Indicator v.1.1 — a free version of the paid indicator with the same name. Comes with four different MetaTrader templates and can be quite tricky to set up. Once set up, offers a rather nice layout of X’s and O’s or boxes directly in the main chart window, with dates, months and years marked directly on the chart — very handy. The chart settings can be adjusted to the smallest details. The main drawback — calculation is very slow and can freeze a trading terminal. Oh, and the source code is not available for tweaking.
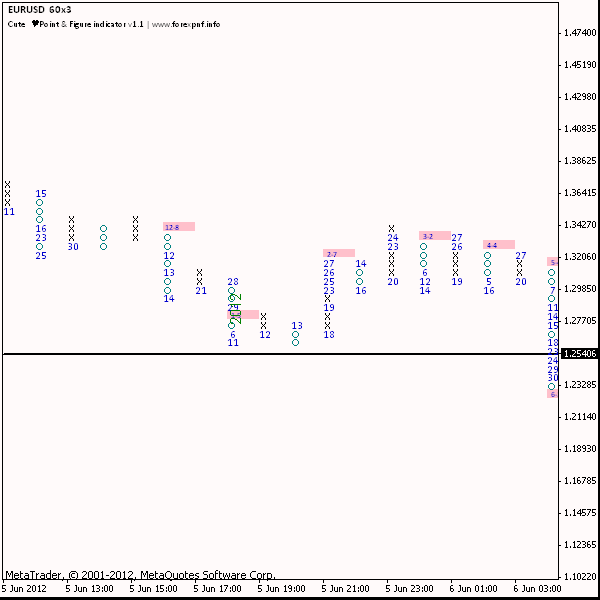
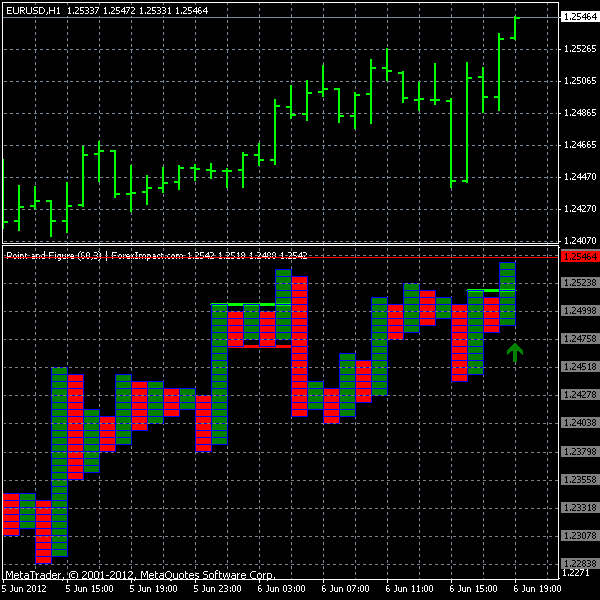
FXI Point and Figure by Forex Impact — not only it is a fully customizable and very fast P&F indicator, it also shows the trendlines for the price movements and gives signals according to the common
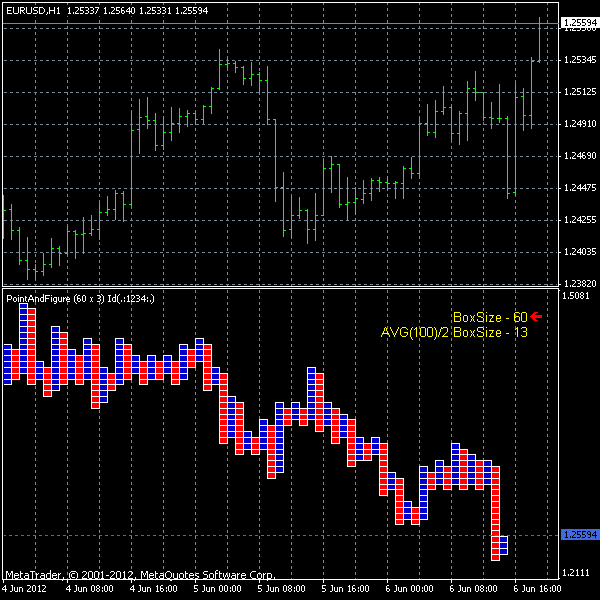
Point and Figure mod 2 offers a rather clear P&F picture for your MetaTrader charts. Box size can be set either manually or calculated by the indicator automatically using the average trading range. A trader can tune the look of the P&F chart and limit the amount of original candles it uses for calculation. This can help if the indicator becomes too slow.
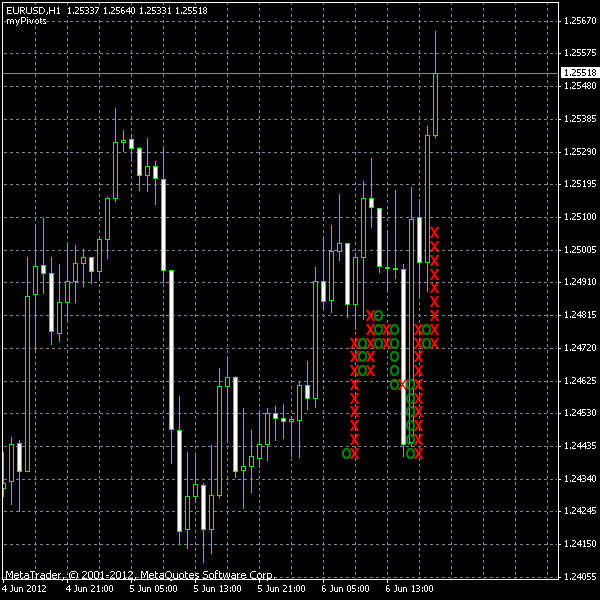
my Point and Figure — my own test
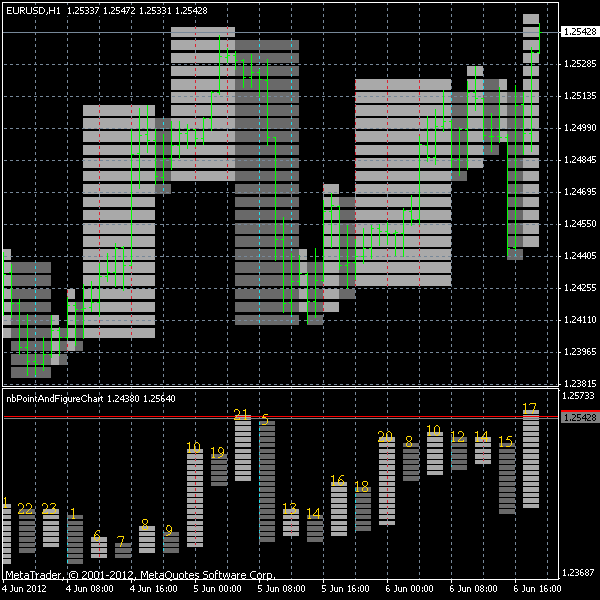
nb Point and Figure — an awesome and fully configurable P&F chart indicator. Not only it can display time information near the XO columns, it also displays projections of the P&F chart onto the main chart, showing which candles relate to which price movement. It works pretty fast and the number of bars it processes can be changed. The disadvantage is that its source code is not available.
MT5
There were no publicly available MT5
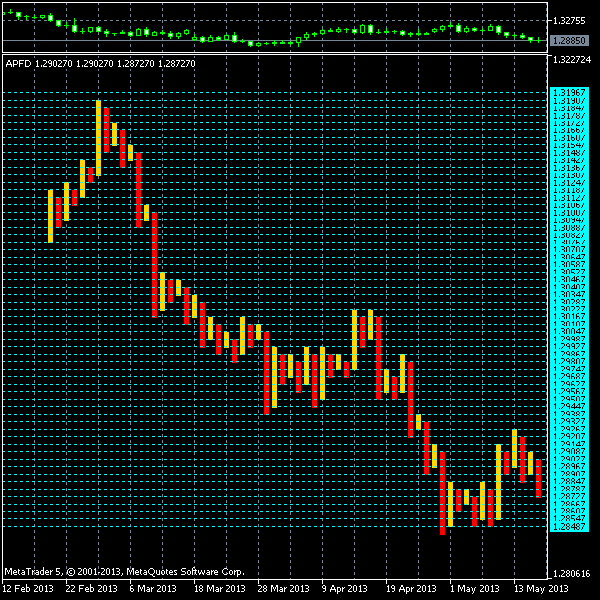
APFD — a detailedly explained
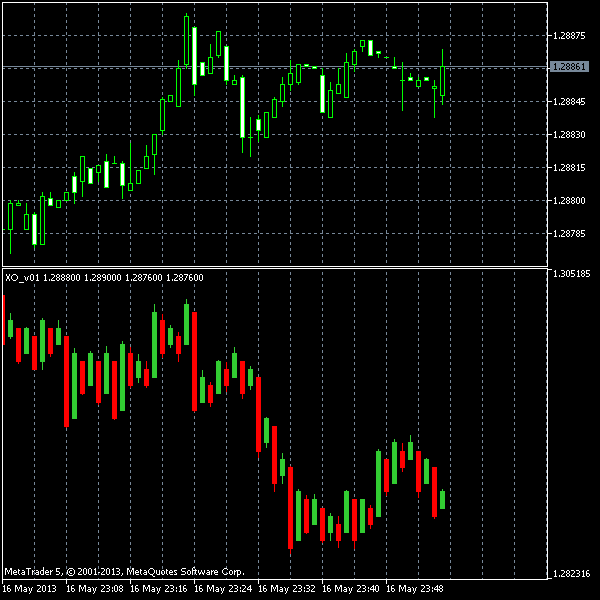
XO v01 — a P&F indicator programmed by Alexey Sergeev and Boris Gershanov from FINEXWARE Technologies GmbH. Same as APFD, it displays the chart plot using candlesticks rather than chart objects, but for some reason it also adds candlewicks to them. Also, it does not show any reference levels in its separate window, and it is really hard to tell how many rising or falling cells are inside one bar. This indicator is plotted based on the chart’s timeframe it is attached to. Although it was published much earlier than APFD, I consider it somewhat inferior to the latter and list it second.
Paid Options
There are also some paid P&F solutions. I have not tested any of them. Obviously, they should be better than the free options, at least in some minor details, but I will leave that for you to discover. By the way, if you have already tried any of
MultiCharts — prices start from $99 per month but a free trial version is available. It is a professional charting software package and it is
TraderPro by Updata — from £49 per month, this software will be able to draw
Bull’
Cute Point & Figure Indicator v.1.3 — a more advanced but paid ($29) version of the
Point and Figure Charts XO Indicator by Itic Software — a rather plain P&F indicator offered for $78.
Books
Free
In addition to the P&F patterns
Point & Figure for Forex — an article from one of the issues of Technical Analysis of Stocks & Commodities magazine back from 2007. It offers a basic explanation of the XO charting and provides descriptions of 6 patterns.
Point and Figure Charting: a Computational Methodology and Trading Rule Performance in the S&P 500 Futures Market — a scientific research paper by John A. Anderson and Robert W. Faff. It provides a clear scientific definition of
Paid
You can also read some of the famous paid books about P&F charting and its secrets:
Point and Figure Charting by Thomas J. Dorsey — a rather expensive book by the P&F guru who also runs PnF University, which offers some free lessons on the subject.
The Definitive Guide to Point and Figure by Jeremy Du Plessis — the book is costly beyond common sense, but is praised by many as a bible of
Conclusion
I have probably overlooked many interesting and powerful P&F charting indicators, software or educational resources. If you know some good examples, please do not hesitate to share.
Update 2013-05-16 22:09 GMT: Added two MT5
If you have anything to add or ask about the use of