- December 21, 2020 Do we get tax benefits on Personal Loan?
- December 18, 2020 The solicitors Preston depends on for stress-free compensation claims
- December 16, 2020 eToro: History and Key Features
- December 11, 2020 Canadian Dollar Pauses 2020 Rally Against US Peer Amid Falling Crude Prices
- December 11, 2020 Pound Crashes Against Dollar As No-Deal Brexit Appears Imminent
- December 11, 2020 USD/JPY 104.57 High Starting a New Bearish Leg?
Day: June 17, 2012
 June 17
2012
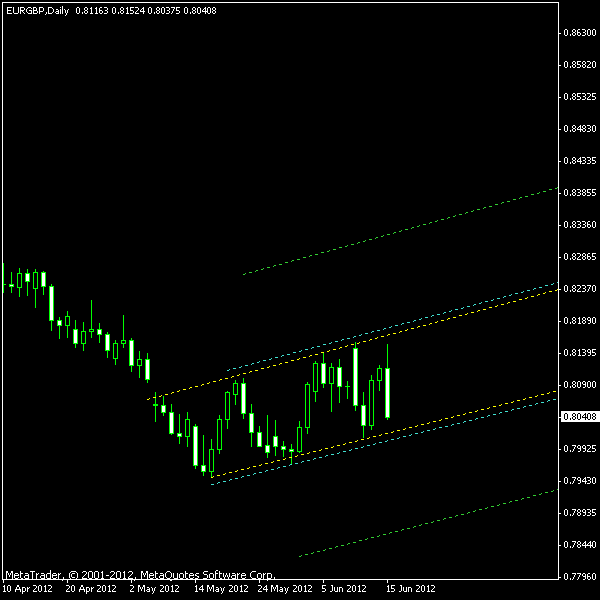
Ascending Channel on EUR/GBP @ D1
The daily chart of EUR/GBP currency pair is currently showing a completely formed ascending channel pattern. Its formation began on May 7 this year after a tremendous weekly price gap, so the channel stands out of the rest of chart bars quite clearly. Also, there were at least four upper and three lower border confirmations. The image below depicts the current EUR/GBP pattern marked with the yellow lines. The cyan […]
Read more June 17
2012
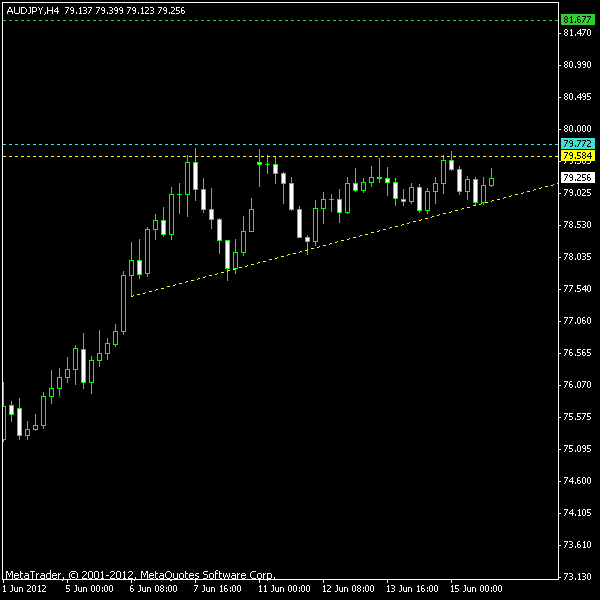
Ascending Triangle on AUD/JPY @ H4
An ascending triangle of a rather rough form is being displayed by the H4 AUD/JPY chart now. The triangle services as a continuation signal for the bullish wave started back on June 1. A bearish breakout is not recommended for trading in case of the ascending triangle Forex pattern. Please see the screenshot of the AUD/JPY chart below. The yellow lines show the triangle’s borders. The horizontal cyan line is a trigger-level for a breakout entry. The horizontal green line is […]
Read more