- December 21, 2020 Do we get tax benefits on Personal Loan?
- December 18, 2020 The solicitors Preston depends on for stress-free compensation claims
- December 16, 2020 eToro: History and Key Features
- December 11, 2020 Canadian Dollar Pauses 2020 Rally Against US Peer Amid Falling Crude Prices
- December 11, 2020 Pound Crashes Against Dollar As No-Deal Brexit Appears Imminent
- December 11, 2020 USD/JPY 104.57 High Starting a New Bearish Leg?
Day: June 2, 2013
 June 2
2013
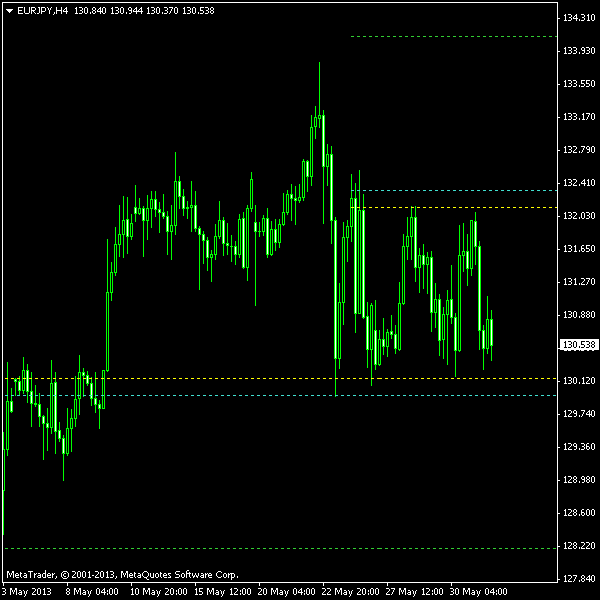
EUR/JPY — A Week-Long Rectangle on H4 Chart
While the position opened using the bullish pennant pattern breakout on EUR/JPY is still running, the currency pair formed a new figure on a shorter timeframe. The rectangle, which spans from May 24 and is about 200 pips high, is a two-way breakout opportunity. The pattern is clearly visible on H4 chart. The image below shows the rectangle with two horizontal yellow lines. At the distance of 10% of its height, the cyan lines […]
Read more June 2
2013
EUR/AUD — A Really Long Ascending Channel on Daily Chart
Today’s EUR/AUD pattern can be traced back to April 24, and the pair’s growth totals nearly 1,000 pips in that period. There have been numerous touches of both borders to confirm the validity of the channel. The biggest problem with this chart formation is that it does not follow a descending trend, whereas classical ascending channel is just a temporary correction for a bearish rally. Nevertheless, I will trade this […]
Read more