2015 Trading Results Poll

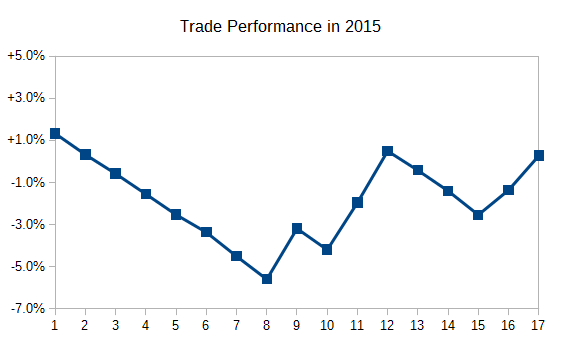
All my 2015 trades are already closed and there is no pending orders carried over into 2016, so it is time to draw a line to look at where I end another year of trading. My profitability in 2015 was way worse than in 2014. 0.2% gain is nothing to be proud of, yet it is not a loss either. In 2015, I have made 17 trades vs. 11 trades in 2014. That brings me to 0.012% profitability per trade. Looks even more dismal, right? But not everything is bad about my last year’s trading results.

Top 3 Trades
What trades have brought me to the positive territory despite a lot of losses? I will sort them according to the reward I took divided by the initial risk (R).

  • The best risk-to-reward ratio (2.55) was on my EUR/JPY ascending channel trade on daily chart. It took one month to trigger and reach the take-profit this summer.
  • The next one is the ascending channel on daily gold that rolled out from mid-October through mid-December. It had R/R of 2.50. It is also a classic example of an ascending channel pattern breakout.
  • My third best trade in 2015 was a short-term sell in NZD/JPY @ H4 based on another ascending channel. It was very fast — just two days — and yielded 2.34R profit.
  • Do you notice the coincidence here? You are right but to a certain extent. Yes, the ascending channels seem like a pure gold. However, you have to consider that 9 out of my 17 trades in 2015 were channels (ascending + descending) and only 5 of those channels were profitable. Which still looks good, of course, but is not as impressive.
    Worst 3 Trades
    I will apply a similar approach measuring the worst trades too. The good thing about the losing trades is that they rarely deviate from 1R loss.

  • Inverted head-and-shoulders on daily EUR/CAD demonstrated a loss of 1.18 × my original risk. The main reason was the Greek shock that caused a major gap in euro pairs’ charts.
  • November’s USD/JPY ascending channel trade on D1 was not a lucky one. It cost me 1.15R and followed another loss on USD/JPY.
  • The breakout of the descending channel on the daily chart of Brent oil in June turned out to be a fakeout and resulted in 1.14R loss for my account.
  • As you can see, the losses are a mixed bag, which just proves the fact that no matter how hard you try, some trades will end up in red.
    Other Trades
    The 17 trades discussed above are my main strategy trades that are based on technical analysis patterns and have rather strict rules of entry and exit. In addition to my main strategy, I sometimes engage in trading based on completely different factors — fundamentals, hedging, sentiment analysis, rumors, whatever. This year, there were three such trades that are not included into the performance results mentioned above:

  • January 2015 USD/RUB long, which ended in a significant loss for me. It was based on a rather comprehensive list of fundamental factors but failed nonetheless. It was a follow-up trade for my 2014 December super-win on USD/RUB.
  • A very strong win on USD/RUB fundamental trade in December. This one took much less analysis but resulted in a confident profit-taking in less than three weeks. The profit, which was about 2R, was three times greater than the loss on the previous USD/RUB trade, making the year for me rather successful overall.
  • A pathetic attempt to short the same USD/RUB on some weak technical analysis signals. It started well but ended in a stop-loss. Luckily, I did not enter big with it and the loss was insignificant.
  • The lesson here is that some well-placed high R/R trades can make the final difference in trading results when you look at the long-term periods, such as a year.

    How profitable was 2015 for you?

    View Results

     Loading …

    If you want to share some more information about your Forex trading results for 2015, please feel free to post a comment using the form below.

    Leave a Reply

    Your email address will not be published. Required fields are marked *

    + 57 = fifty eight