- December 21, 2020 Do we get tax benefits on Personal Loan?
- December 18, 2020 The solicitors Preston depends on for stress-free compensation claims
- December 16, 2020 eToro: History and Key Features
- December 11, 2020 Canadian Dollar Pauses 2020 Rally Against US Peer Amid Falling Crude Prices
- December 11, 2020 Pound Crashes Against Dollar As No-Deal Brexit Appears Imminent
- December 11, 2020 USD/JPY 104.57 High Starting a New Bearish Leg?
Technical Analysis
 February 19
2017
GBP/JPY — Another Pound Pair Consolidates in Symmetrical Triangle
I have already written about a symmetrical triangle on GBP/CHF weekly chart 2 weeks ago. Today, you can see a similar pattern but with a different trend direction on the daily chart of the pound/yen pair. This consolidation finishes off the uptrend that lasted from October through mid-December and offers a nice opportunity to go long in case of an upper border breakout. The pattern is marked with the yellow lines on the chart screenshot […]
Read more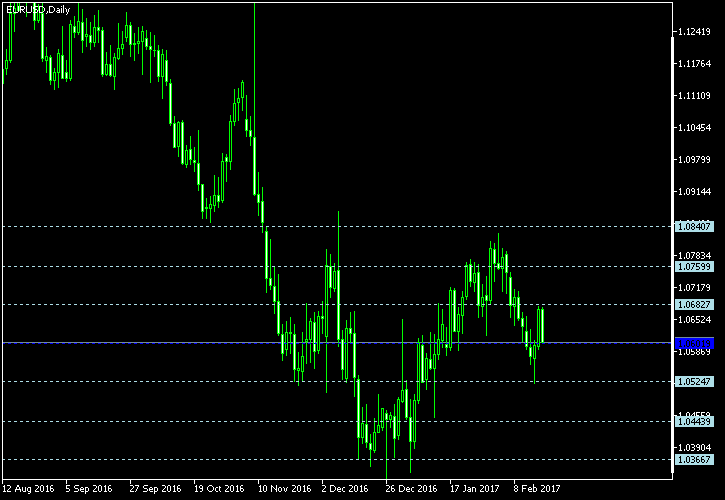 February 18
2017
Weekly Forex Technical Analysis (Feb 20 — Feb 24)
EUR/USD Floor pivot points 3rd Sup 2nd Sup 1st Sup Pivot 1st Res 2nd Res 3rd Res 1.0367 1.0444 1.0525 1.0602 1.0683 1.0760 1.0841 Woodie’s pivot points 2nd Sup 1st Sup Pivot 1st Res 2nd Res 1.0445 1.0527 1.0603 1.0685 1.0761 Camarilla pivot points 4th Sup 3rd Sup 2nd Sup 1st Sup 1st Res 2nd […]
Read more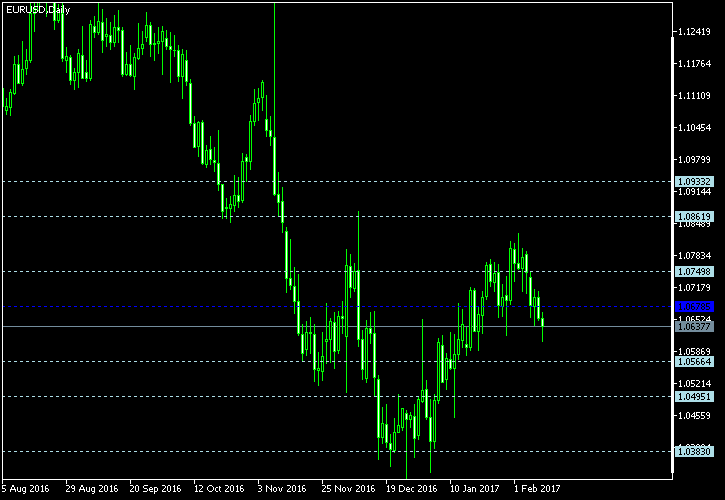 February 11
2017
Weekly Forex Technical Analysis (Feb 13 — Feb 17)
EUR/USD Floor pivot points 3rd Sup 2nd Sup 1st Sup Pivot 1st Res 2nd Res 3rd Res 1.0383 1.0495 1.0566 1.0679 1.0750 1.0862 1.0933 Woodie’s pivot points 2nd Sup 1st Sup Pivot 1st Res 2nd Res 1.0485 1.0546 1.0668 1.0729 1.0852 Camarilla pivot points 4th Sup 3rd Sup 2nd Sup 1st Sup 1st Res 2nd […]
Read more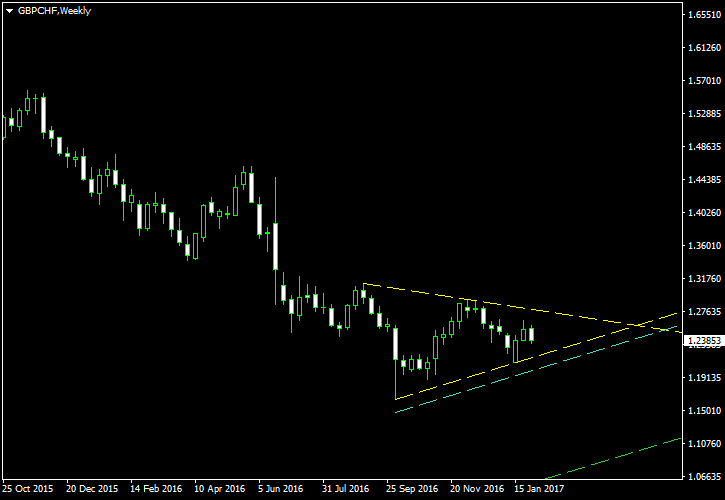 February 5
2017
GBP/CHF Consolidated in Triangle, Ready for Breakout
The British pound looks to be prepared for a continuation of its long-term downtrend against the Swiss franc. The GBP/CHF currency pair has formed a nearly perfect symmetrical triangle on its weekly chart. A downtrend breakout would definitely mean a bearish trend here. The triangle is bordered with the yellow lines on the chart screenshot below. The cyan line is my entry level, which is positioned at 10% of the triangles width (at base) subtracted from […]
Read more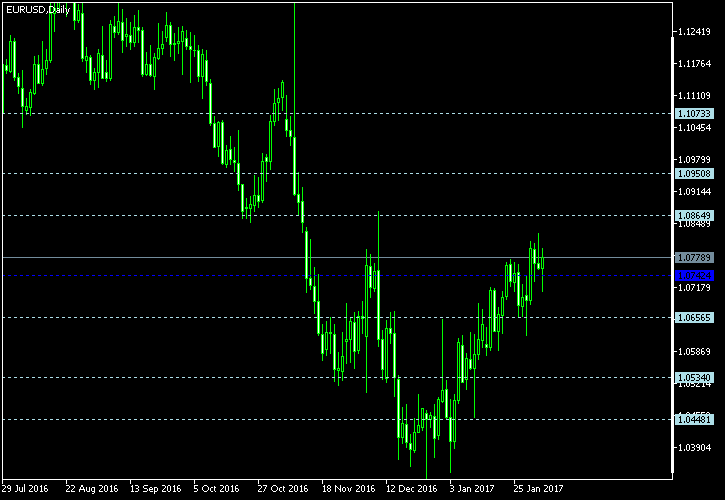 February 4
2017
Weekly Forex Technical Analysis (Feb 6 — Feb 10)
EUR/USD Floor pivot points 3rd Sup 2nd Sup 1st Sup Pivot 1st Res 2nd Res 3rd Res 1.0448 1.0534 1.0656 1.0742 1.0865 1.0951 1.1073 Woodie’s pivot points 2nd Sup 1st Sup Pivot 1st Res 2nd Res 1.0543 1.0675 1.0752 1.0883 1.0960 Camarilla pivot points 4th Sup 3rd Sup 2nd Sup 1st Sup 1st Res 2nd […]
Read more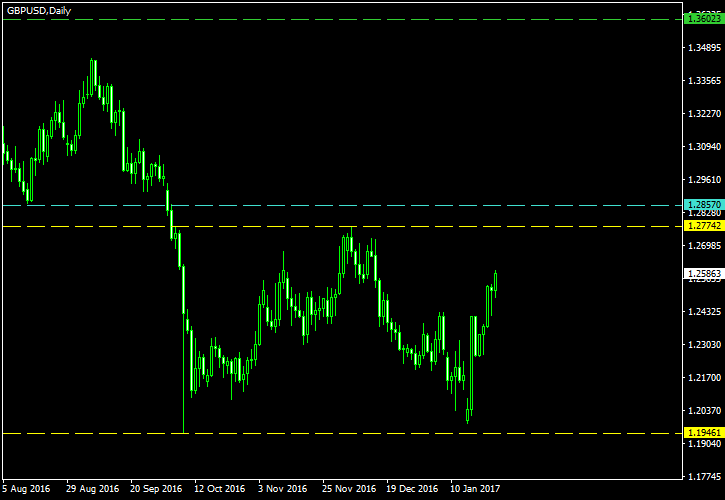 January 29
2017
Double Bottom May Put an End to GBP/USD Downtrend
The double bottom that is currently forming on the daily GBP/USD chart has a potential for stopping the medium-term bearish trend that persists since the Brexit referendum. The formation is not ideal — it lacks symmetry and has a malformed middle part. Yet it may offer a valid trading signal in case of the upside breakout. The image below shows the double bottom marked with the yellow lines. The lower one marks the two troughs. […]
Read more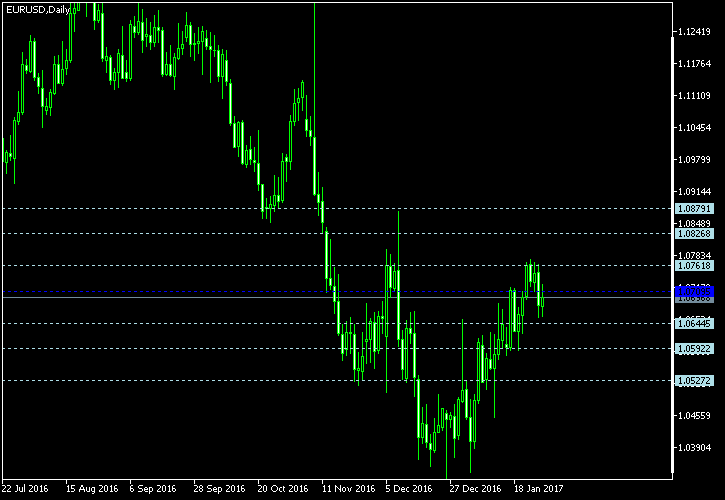 January 28
2017
Weekly Forex Technical Analysis (Jan 30 — Feb 3)
EUR/USD Floor pivot points 3rd Sup 2nd Sup 1st Sup Pivot 1st Res 2nd Res 3rd Res 1.0527 1.0592 1.0645 1.0710 1.0762 1.0827 1.0879 Woodie’s pivot points 2nd Sup 1st Sup Pivot 1st Res 2nd Res 1.0589 1.0638 1.0706 1.0755 1.0824 Camarilla pivot points 4th Sup 3rd Sup 2nd Sup 1st Sup 1st Res 2nd […]
Read more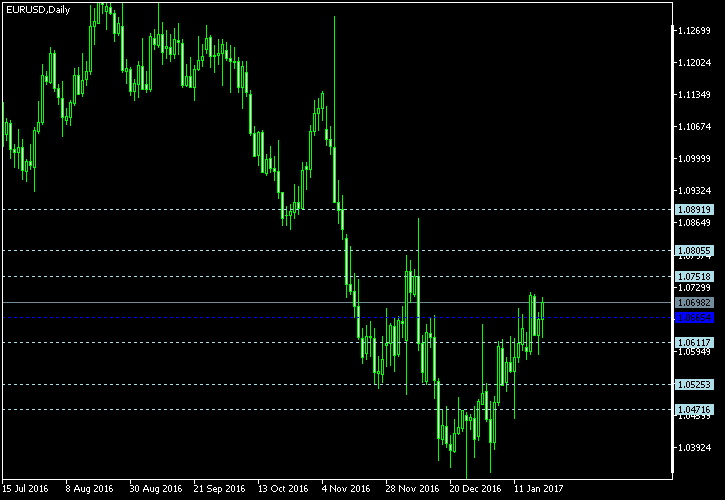 January 21
2017
Weekly Forex Technical Analysis (Jan 23 — Jan 27)
EUR/USD Floor pivot points 3rd Sup 2nd Sup 1st Sup Pivot 1st Res 2nd Res 3rd Res 1.0472 1.0525 1.0612 1.0665 1.0752 1.0805 1.0892 Woodie’s pivot points 2nd Sup 1st Sup Pivot 1st Res 2nd Res 1.0533 1.0628 1.0674 1.0768 1.0814 Camarilla pivot points 4th Sup 3rd Sup 2nd Sup 1st Sup 1st Res 2nd […]
Read more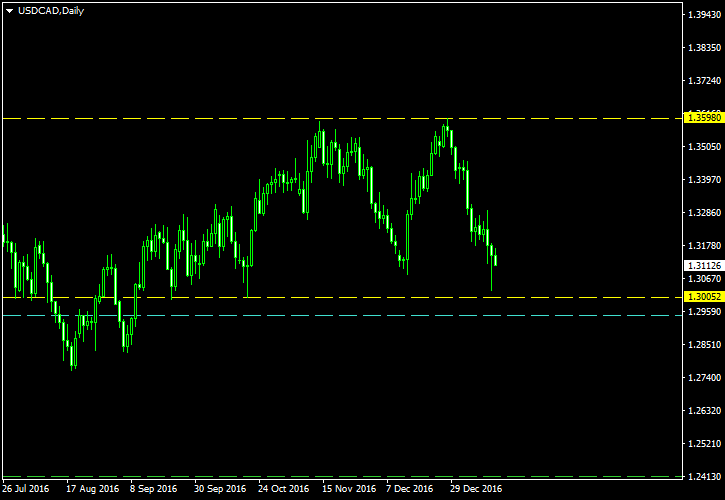 January 15
2017
Another Bearish Signal for USD/CAD — Double Top on D1
The Canadian dollar has formed another bearish pattern against its US counterpart — this time on the daily chart. The previous pattern (ascending channel) is still in play but does not look too good. The current pattern is not an ideal double top formation. Yet, the break below this double top’s neckline would constitute a valid entry signal and would definitely reinforce the earlier signal too. The pattern […]
Read more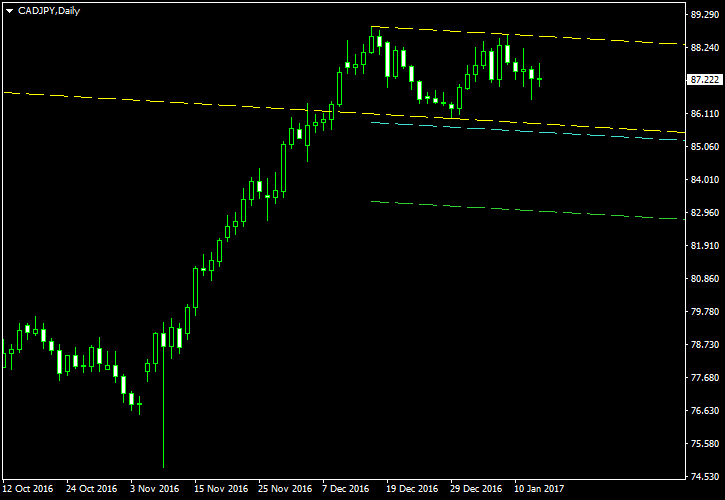 January 15
2017
Double Top on CAD/JPY Daily Chart
I am presenting yet another pattern with the Canadian dollar in the main role. The double top on USD/CAD is still a pending one, while the USD/CAD channel is already trading. The double top on CAD/JPY is a bit different in the sense that it is bearish for CAD, not for the other currency. In this case, a successful breakout from this double top will cause the Japanese yen to appreciate versus the loonie. The pattern tops […]
Read more