- December 21, 2020 Do we get tax benefits on Personal Loan?
- December 18, 2020 The solicitors Preston depends on for stress-free compensation claims
- December 16, 2020 eToro: History and Key Features
- December 11, 2020 Canadian Dollar Pauses 2020 Rally Against US Peer Amid Falling Crude Prices
- December 11, 2020 Pound Crashes Against Dollar As No-Deal Brexit Appears Imminent
- December 11, 2020 USD/JPY 104.57 High Starting a New Bearish Leg?
Day: December 18, 2011
 December 18
2011
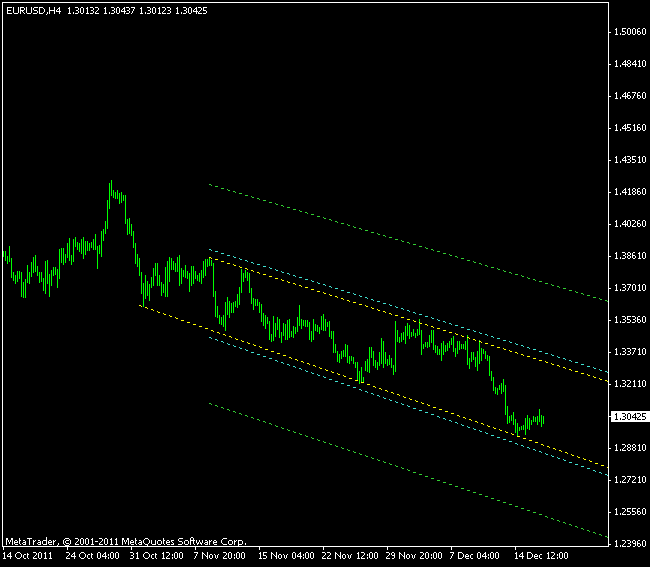
Descending H4 Channel on EUR/USD Chart
Following the success of the channel pattern formed on EUR/USD H4 chart last week, the price has created another channel opportunity for Forex traders. The new descending channel is quite long — it begins on November 1st, and the borders of the pattern have been confirmed 9 times already. It’s a slightly widening channel, but it still can produce a rather reliable trading signal. The pattern is 373 pips high. The breakout […]
Read more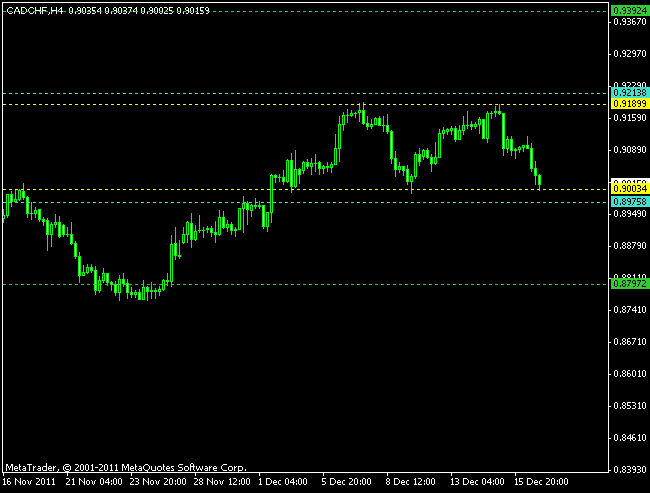 December 18
2011
Double Top on CAD/CHF @ H4 Chart
CAD/CHF is a pretty exotic currency pair and I personally haven’t ever opened a single position on it. But currently I see a good opportunity to start trading this pair — a double top formation on H4 chart. The figure is reliable on long-term charts, but even H4 can be reliable if the pattern is 2 weeks old and is so clearly defined. I use 10% levels of the pattern’s height (198 pips) […]
Read more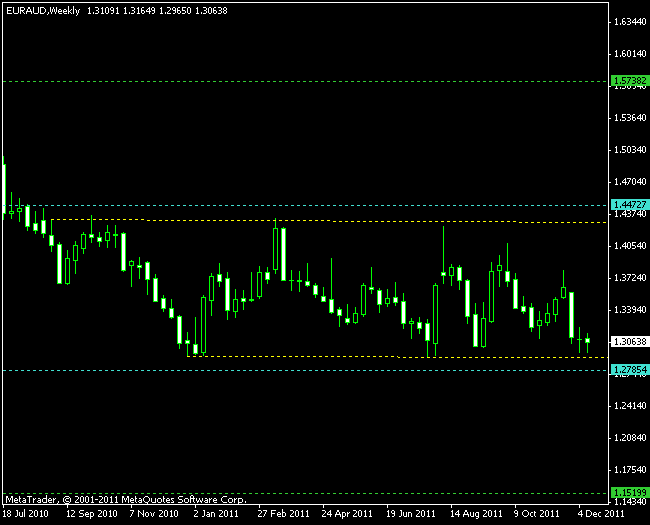 December 18
2011
Another Channel Pattern — This Time on EUR/AUD W1 Chart
Another channel pattern for today was formed by the EUR/AUD currency pair on the weekly chart. It dates back to late August 2010 and is a really good example of a long-term channel pattern, despite the fact that the upper border is sloping down slightly. It’s a really high channel — 1,406 pips — a desirable prize for any FX trader. The breakout levels are located quite far from the actual borders of the pattern because […]
Read more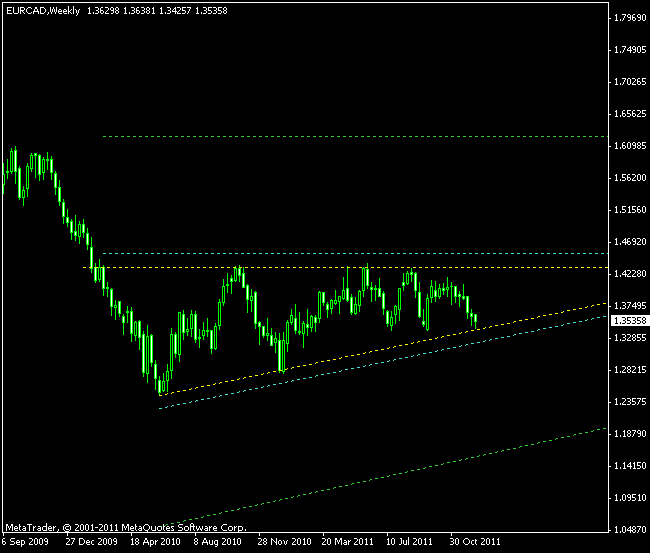 December 18
2011
Ascending Triangle on EUR/CAD Weekly Chart
Ascending triangle is one of the best trend continuation patterns. The one has recently formed on the EUR/CAD weekly chart. It’s lasting from February 2010 and can boast 7 touching points of price with the pattern’s borders. There’s one significant problem with this pattern though — it’s formed at the end of the bearish trend, while the classical ascending triangle should trigger a bullish continuation. That’s why I offer two breakout […]
Read more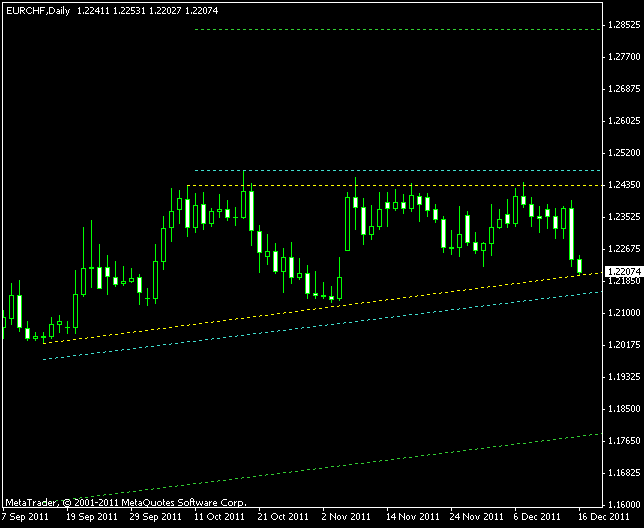 December 18
2011
EUR/CHF Ascending Triangle on Daily Chart
Another ascending triangle pattern can be easily seen on the EUR/CHF daily chart, unlike the one of the EUR/CAD chart, this one is actually continuing the previous bullish trend. The problem with this pattern is the fact that the latest lower border point is formed by the low of the latest trading session, which isn’t reliable at all. The initial height of the pattern is 412 pips, which added to the upper border becomes […]
Read more December 18
2011
USD/CAD Daily Chart Shows Symmetrical Triangles
Symmetrical triangles is often a reliable continuation pattern, but this time it continues a rather short-term trend, which can result in a tricky trade outcome. Anyway, it’s useful to monitor the USD/CAD D1 chart for both bullish and bearish breakouts, as both borders of the triangles are clearly defined and the pattern is very symmetrical. The height of the whole pattern is 931 pips here. But, unlike the previous chart patterns, the symmetrical […]
Read more